
The only 5 Product Discovery frameworks you need to start delivering value
From Research questions to Opportunity Solution Trees

Is this read for you? TL;DR of these 4.8K words:
Frameworks are great, but there are 100+ of them. It’s noisy and overwhelming.
You really only need 5 that work really well together:
Triple Diamond (bigger picture), Landscape of User Research Methods (better questions), Levers (identify patterns), Atomic Research (strengthen signal), and Opportunity Solution Tree (connect your work)
This deep dive gives you a strong foundation in the discovery process and its key principles; you’ll know what (not) to do to start delivering value
We ended the previous post saying that shit ideas in = shit results out. The only way to break the cycle is doing more Product Discovery.
It’s easy to get stuck when figuring out the doing part though. There are 100+ fragmented frameworks out there. It’s hard to see which ones you really need or how they’re supposed to work together.
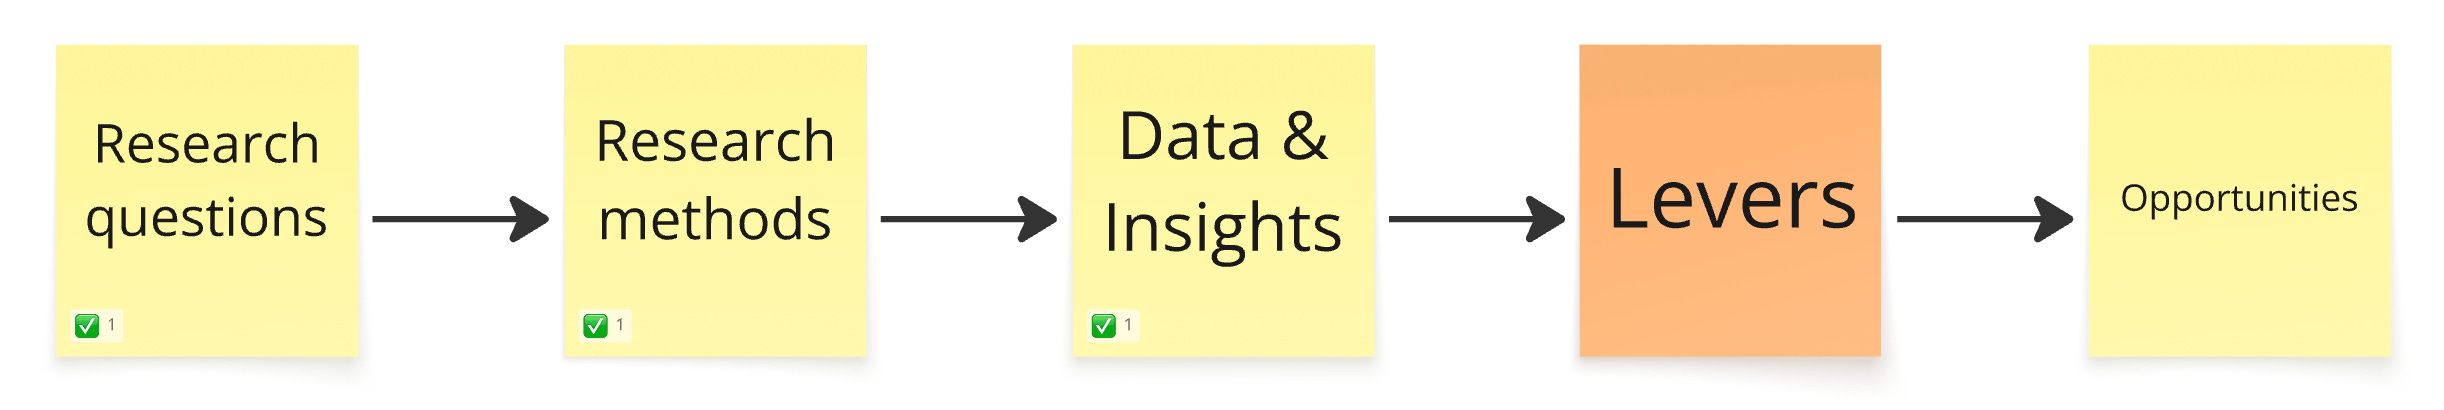
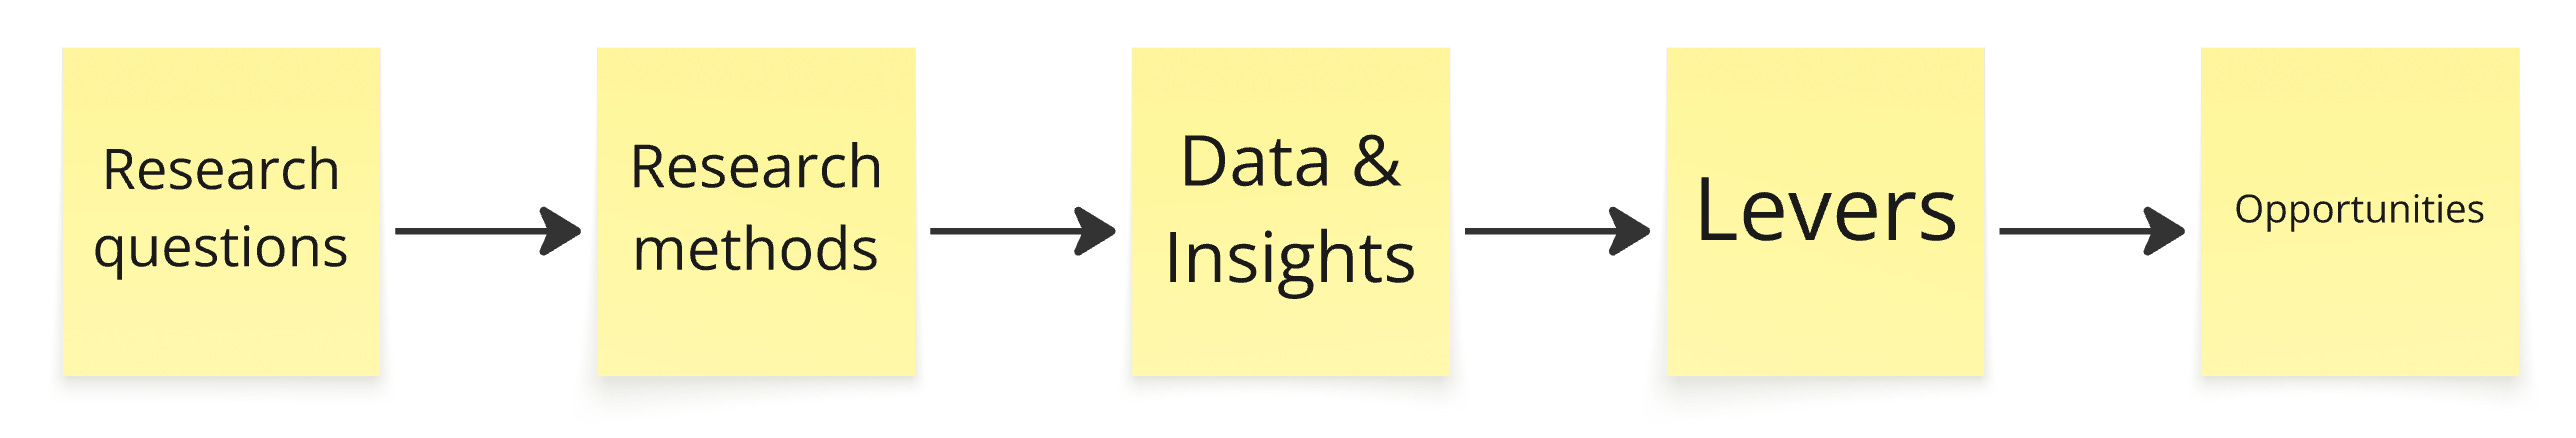
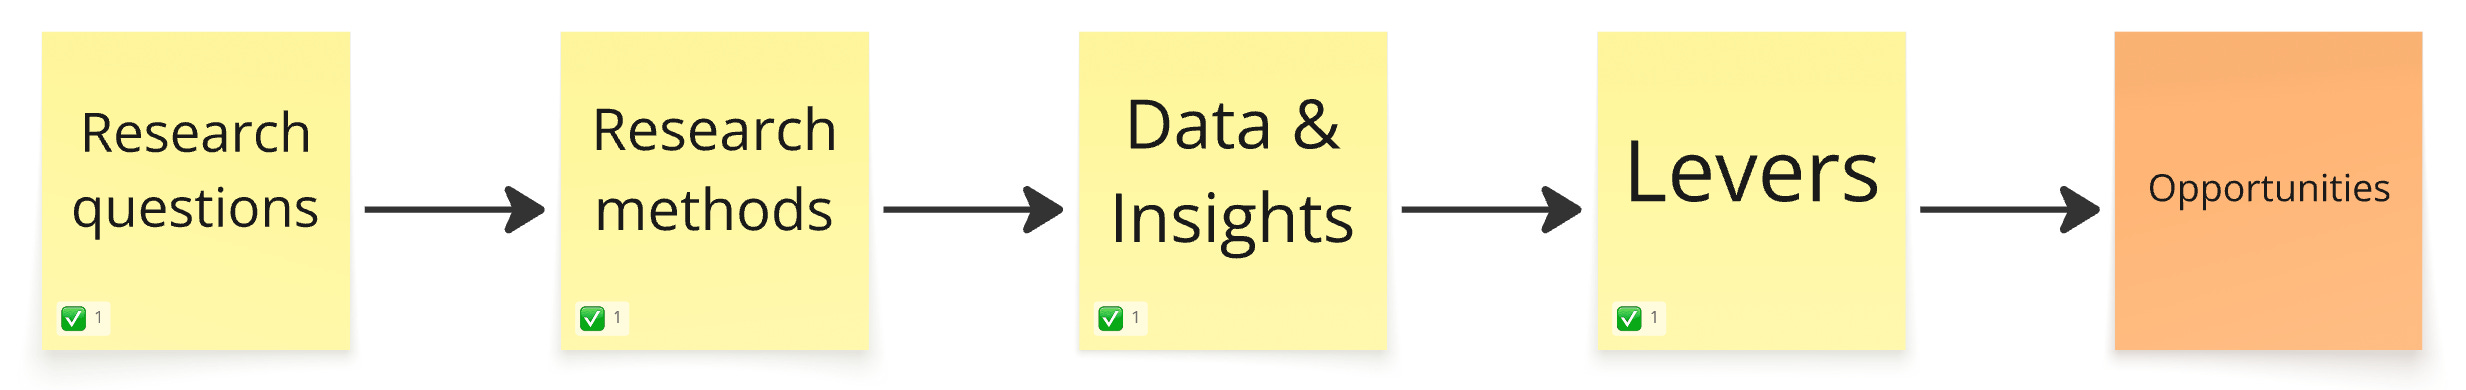
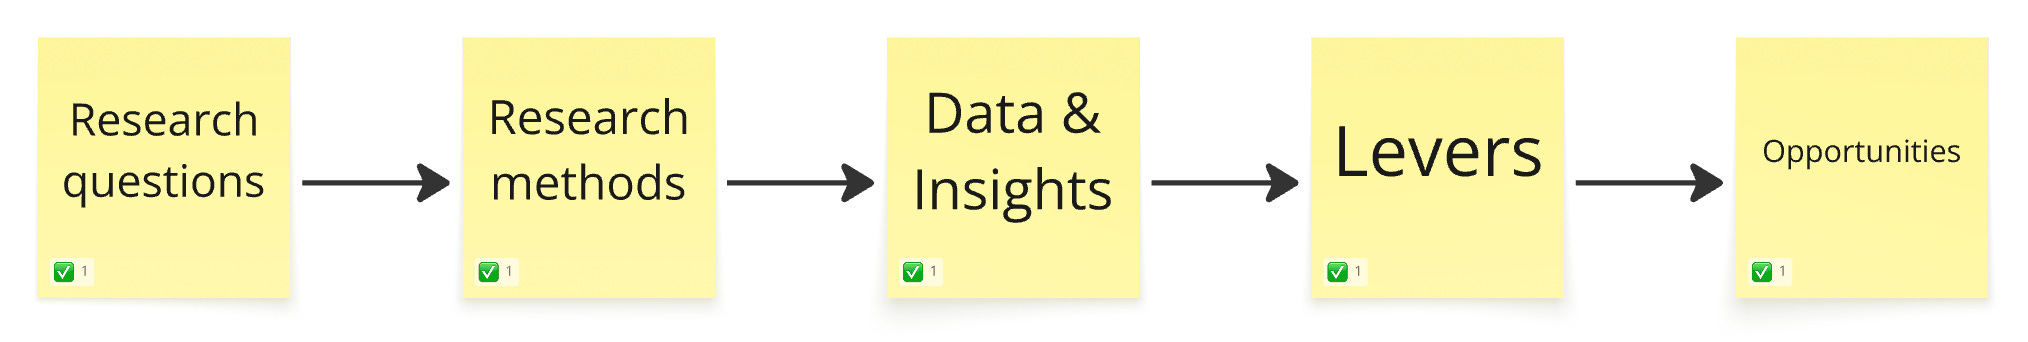
Collecting them all is boring, plus I think you really only need 5 to get from Research questions (the starting point) to Opportunities (the endgame).
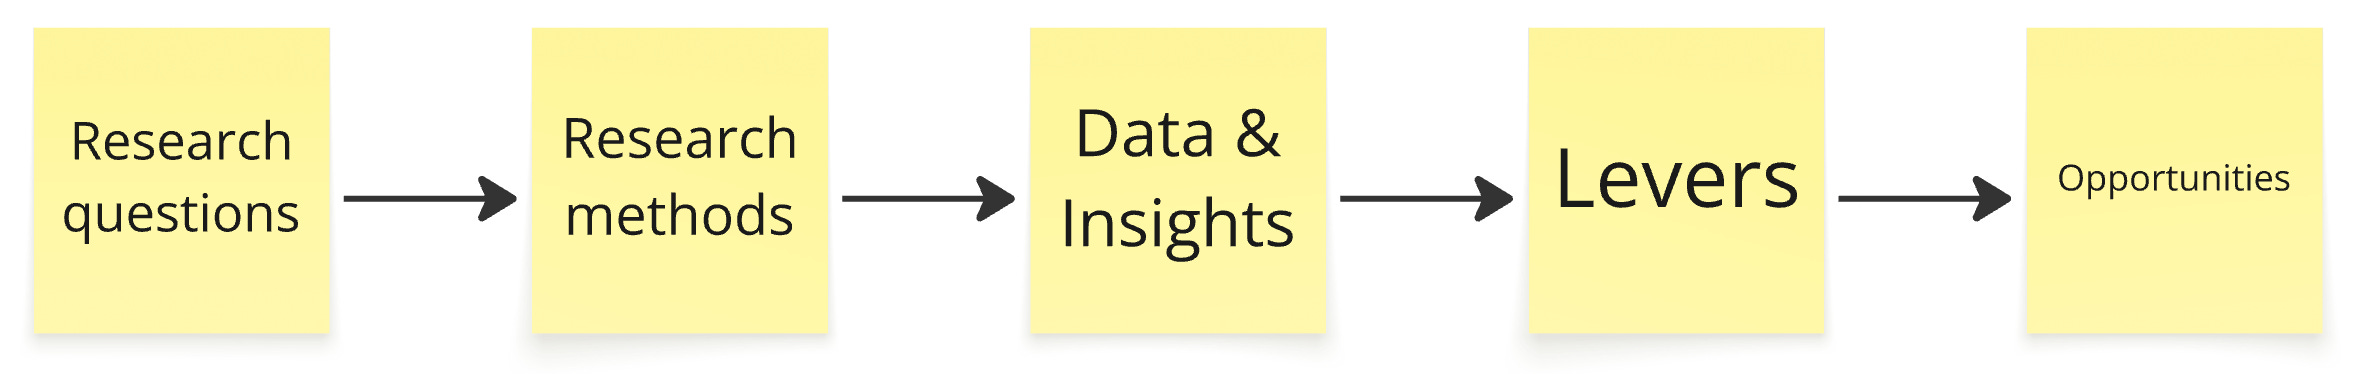
To start delivering value, all you really need is:
First see the bigger picture, The Triple Diamond
Ask better questions for better insights, Landscape of User Research methods.
Make sense of those insights: identify the patterns, Levers Framework.
Strengthen the signal by stacking your research methods, Atomic Research
Manage and properly connect all your work, Opportunity Solution Trees
You’ll also see that if you really understand these 5, you probably understand 90% of all the other frameworks out there too.
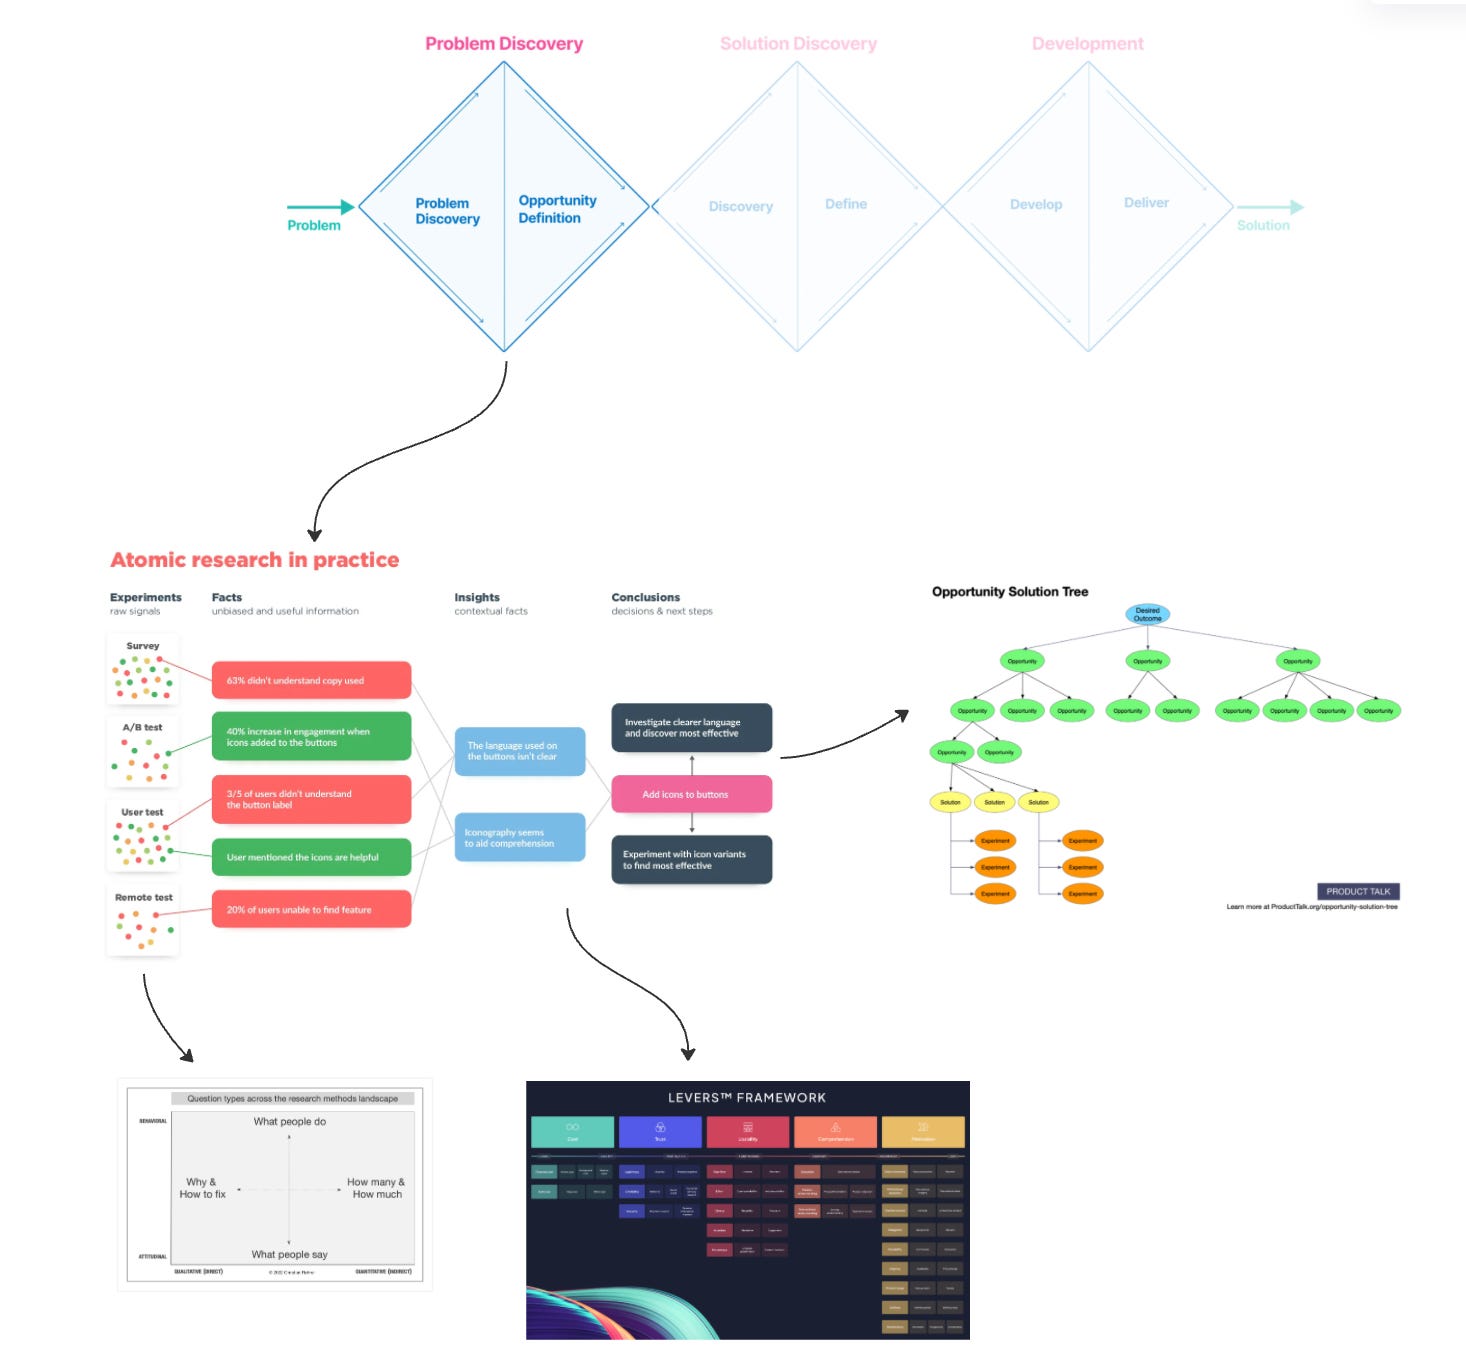
We’re going in deep. By the end of this post this abomination is going to make total sense:
1. First see the bigger picture, The Triple Diamond
We’re going to take on this one first because it sets us up with the basic context in which we can place all the other things coming up. It’s also a fundamental piece: you can’t not run into this when doing Discovery, so it’s good to get familiar with it.
Source: Bootcamp on Medium
What’s going on
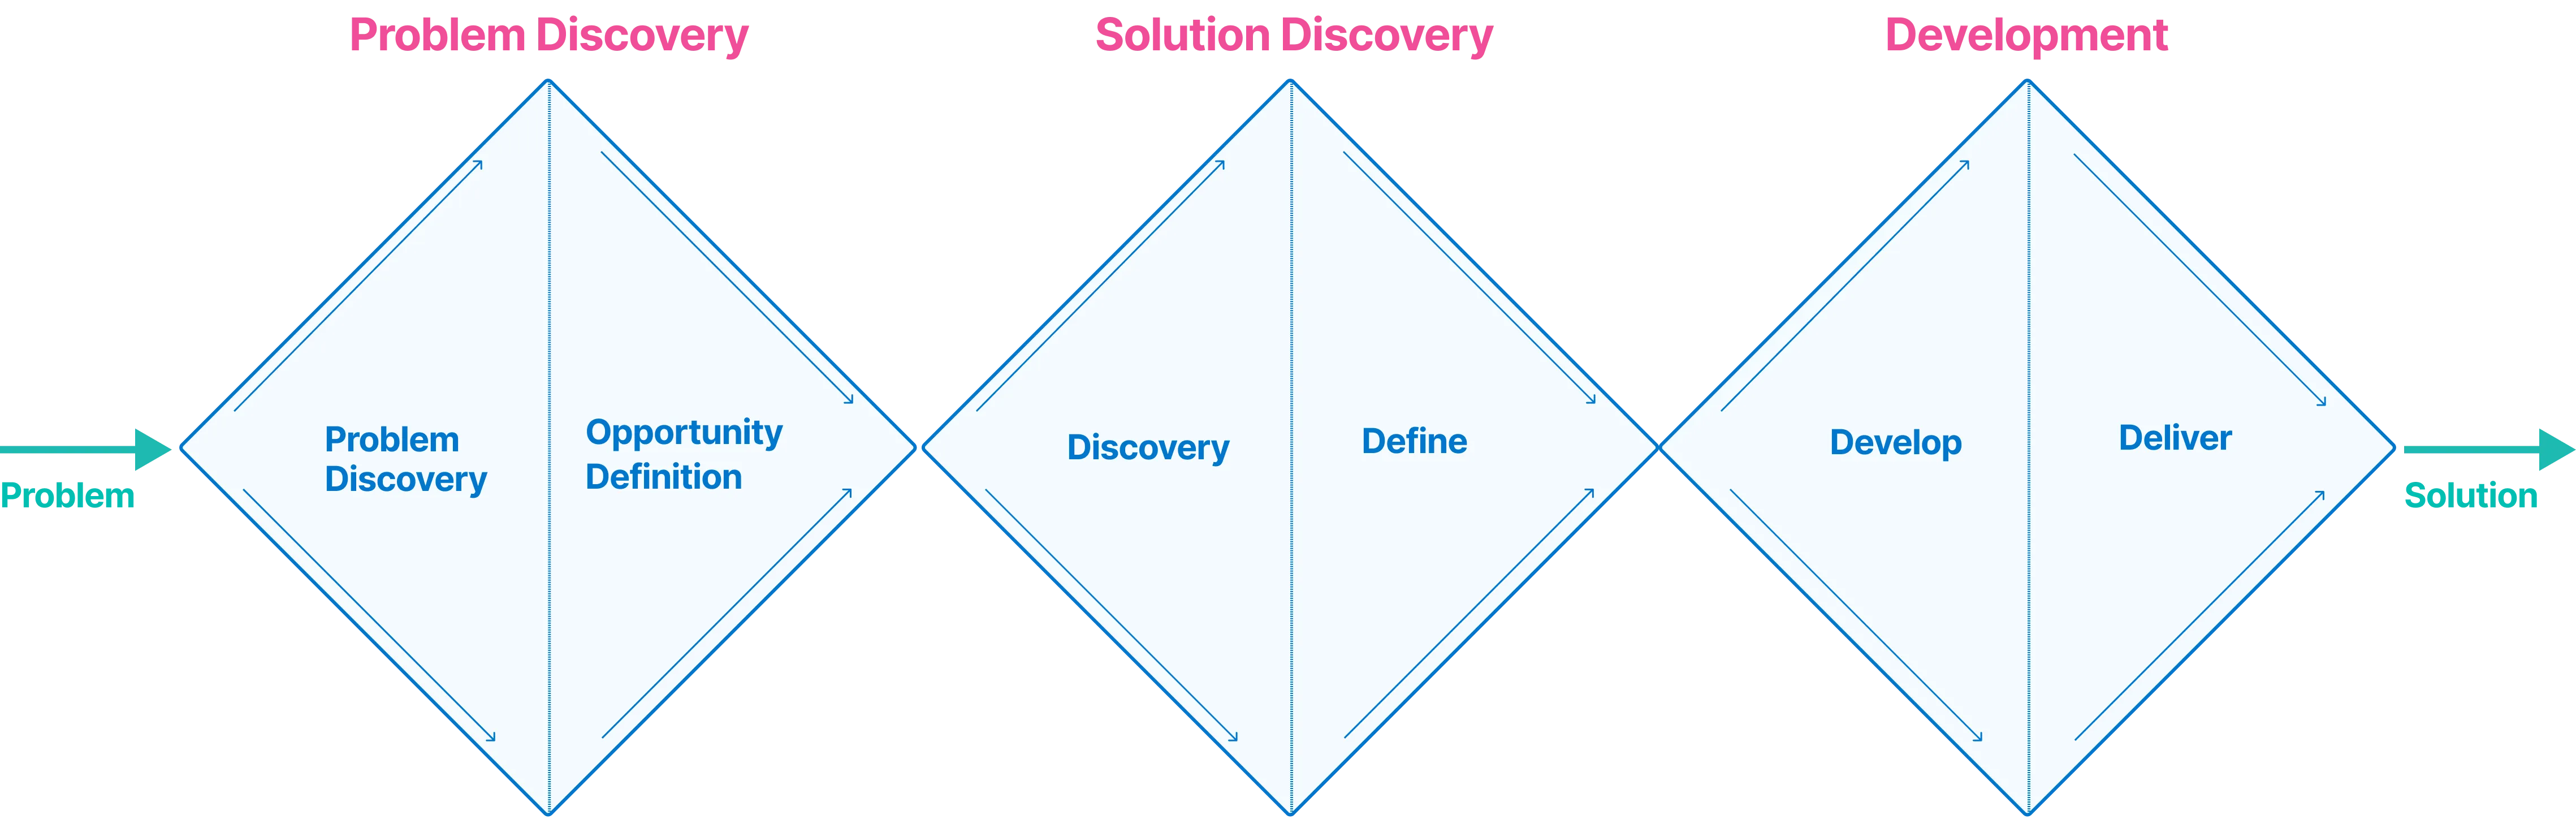
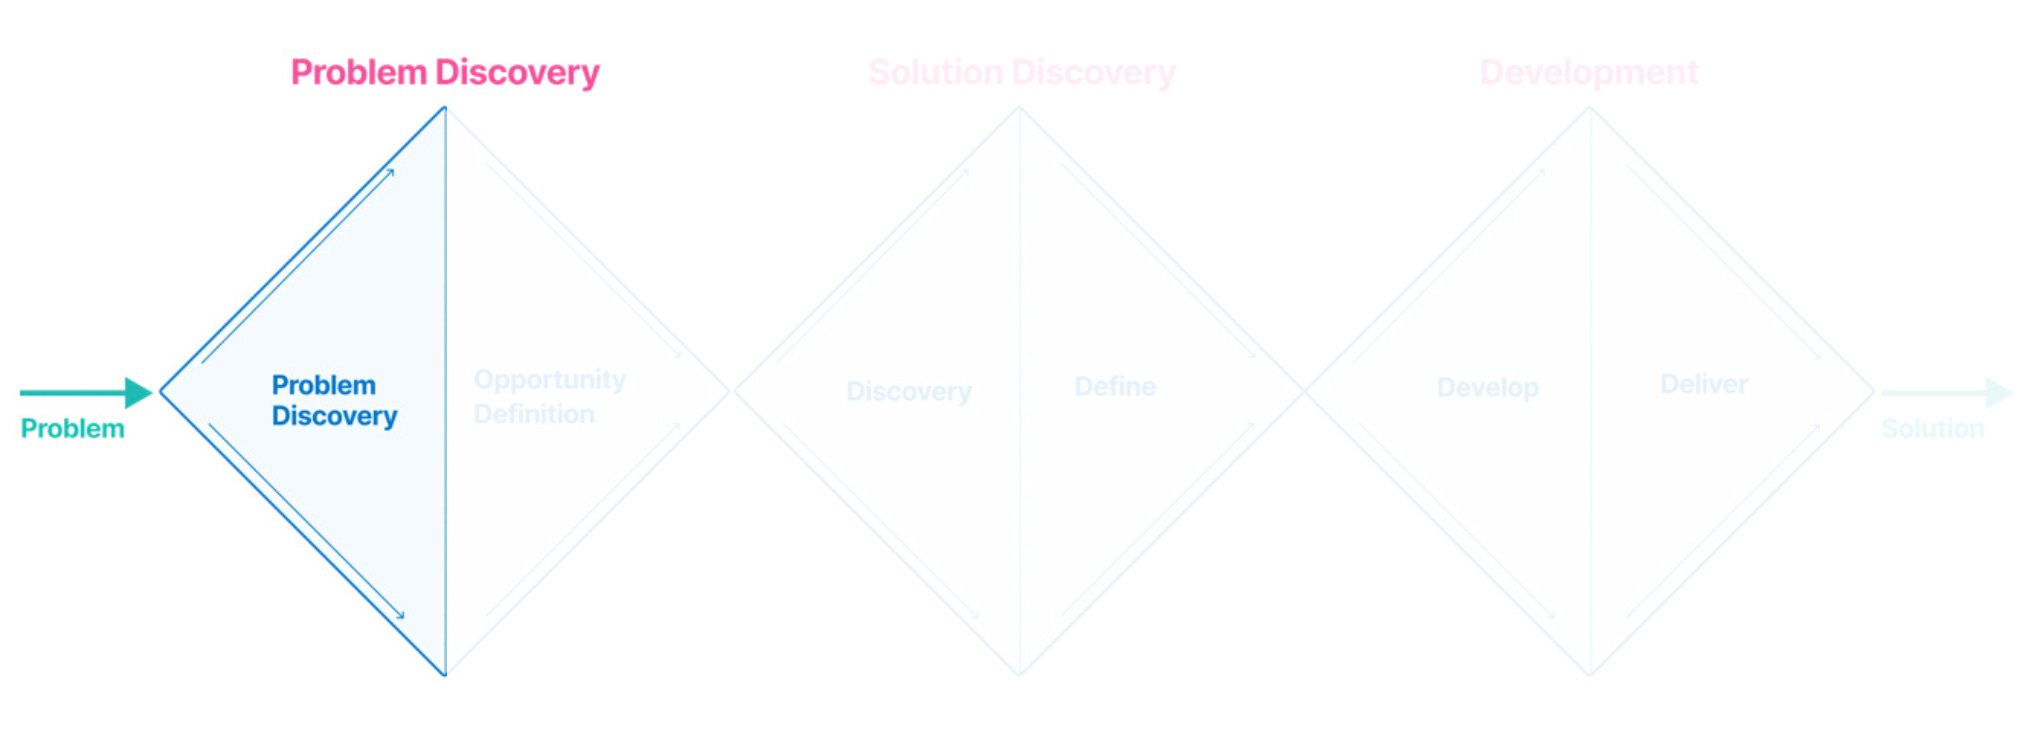
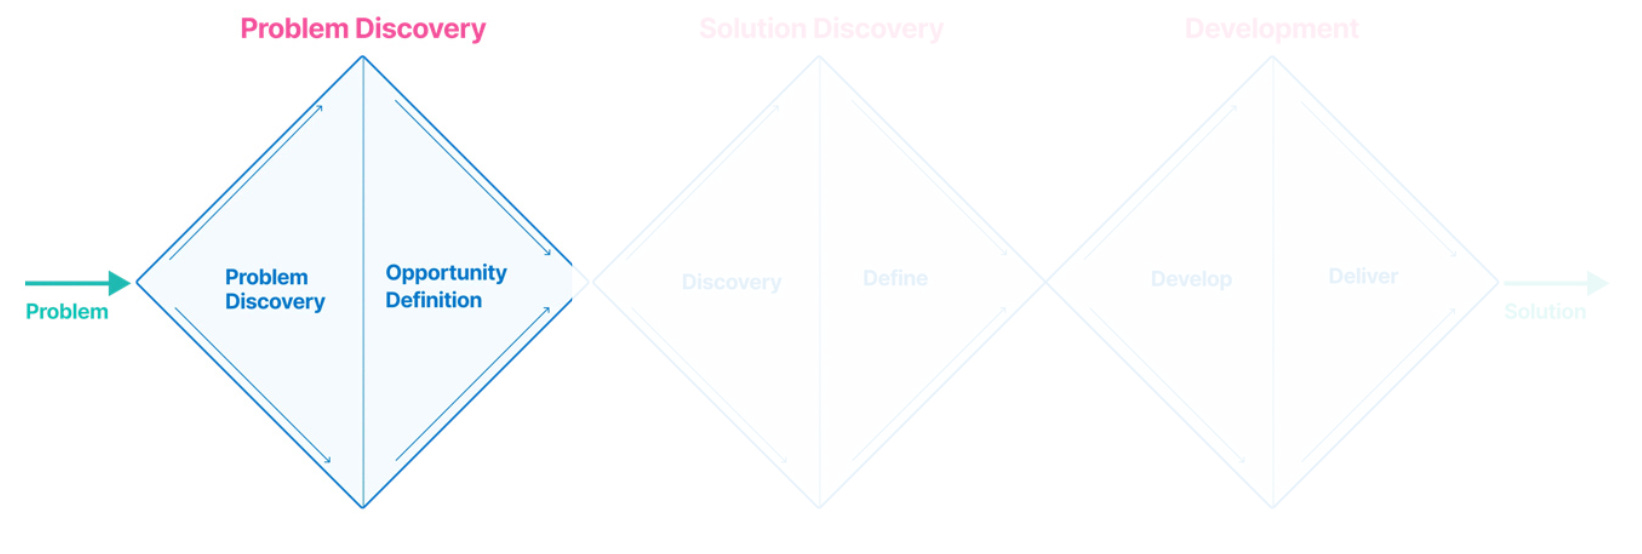
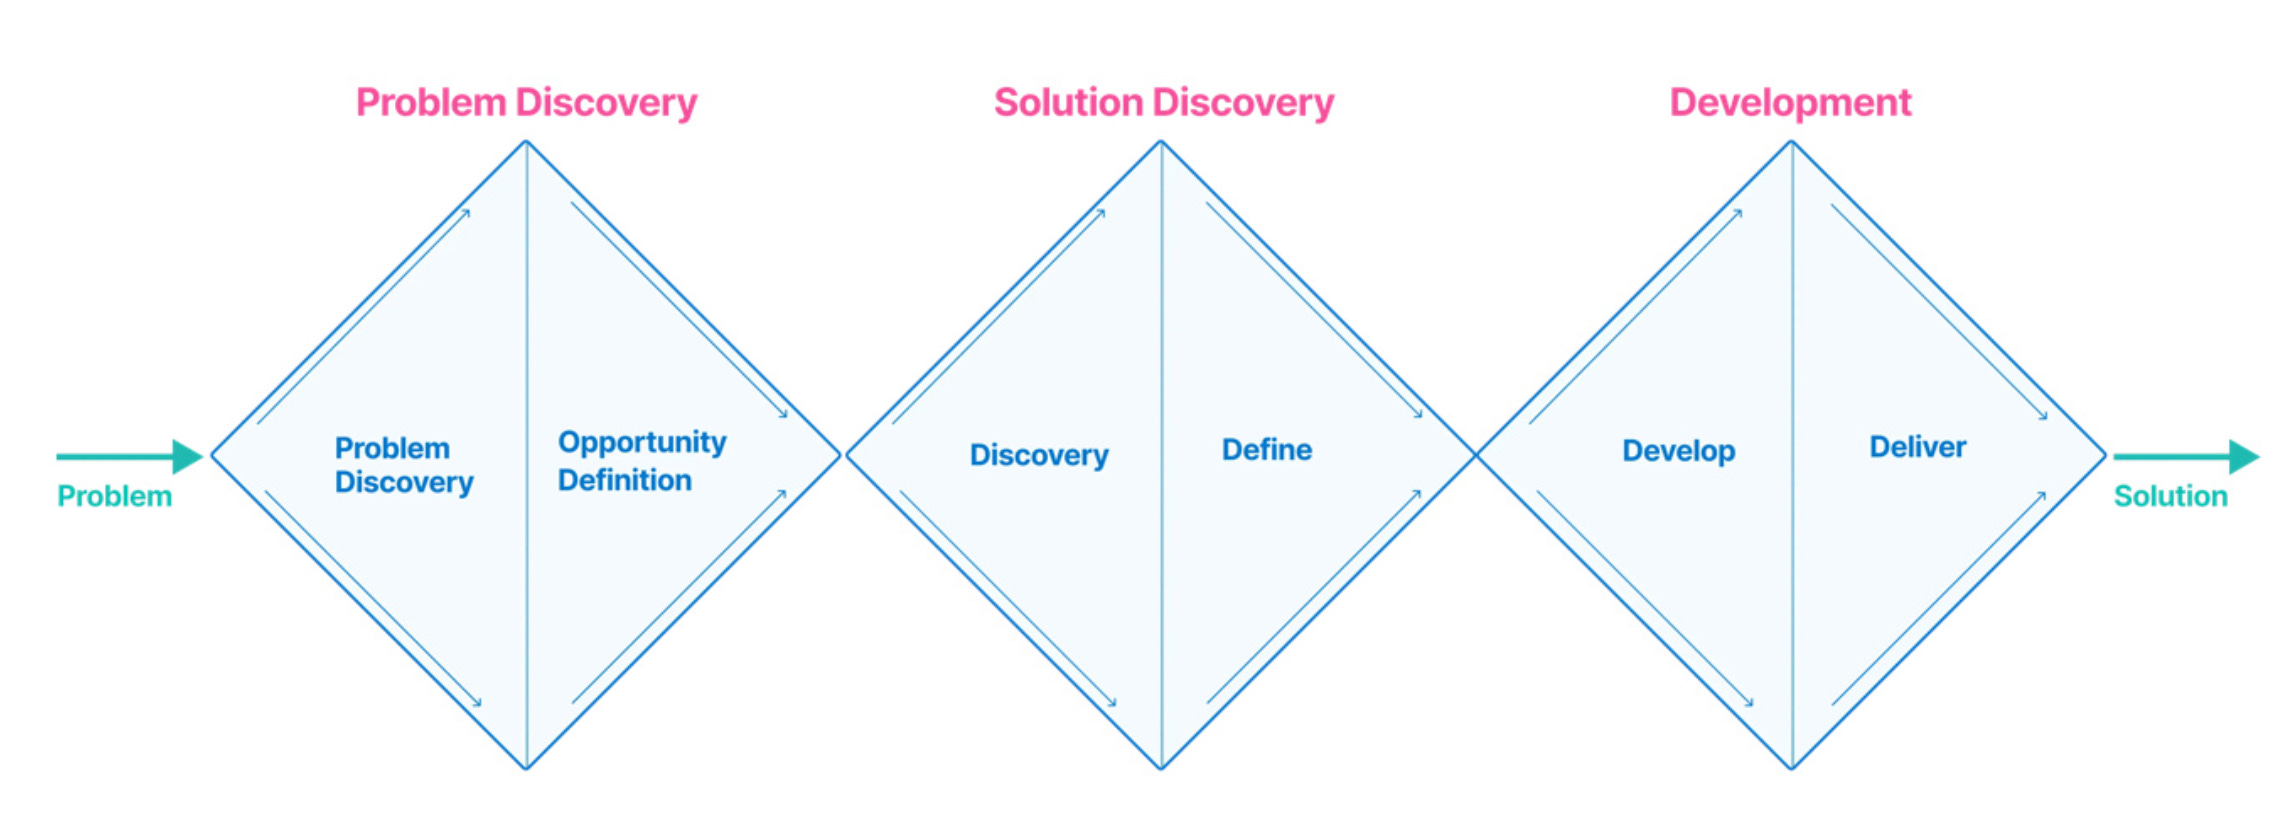
It tells us which phases we go through if we want to get from a problem to a solution, which is exactly what we need to do. It just describes the phases though, it doesn’t exactly tell us how we do the work. We’ll get to that later.
The 1st phase is Problem Discovery. First you find and properly understand the problem (also called Problem Discovery), then you make the problem concrete in Opportunity Definition.
The 2nd phase is Solution Discovery. First you discover potential solutions, then you decide which one to go for.
The 3rd phase is Development. First you build the solution, then you deliver the solution.
Problem in, solution out. No need to further complicate things.
Everything that is coming up next in this chapter (and almost everything in this entire guide) takes place in that 1st Problem Discovery phase.
The value for us in practice
This framework is a solid reminder of some of the core principles of Product Discovery:
There’s a certain sequentiality in which to do things
There’s a point when you’ve done enough problem or solution discovery
1. There’s a certain sequentiality in which to do things
You start with a problem to solve, then you find a solution, then you build it. Sounds logical? Wait until you see teams starting at phase 2 or even phase 3 wonder why the things they’re building don’t have any impact; they skip phase 1.
But I guess that’s why you’re here.
2. There’s a point where you’ve done enough problem or solution discovery
You can discover (diverge) forever, but you need to start defining (converge) at some point if you ever want to deliver value to users.
It’s a trap to always be looking for more data and insights. A trap you ABSOLUTELY will run into when starting out. And yes, this is exactly why the framework uses diamonds- to visualise the diverging / converging cycle.
Its simplicity makes it very shareable with your colleagues. It will help get these 3 principles across. Throw this thing in a presentation as a suggested way of working when your team is skipping phase 1 for example. Just once though, no one wants to hear about your processes all the time. It’s boring.
An easy start. As I said: it’s a fundamental, and we’ll further build upon it over the next chapters. I hope you’re warmed up because the next framework is going to be a lot more detailed.
2. Ask better questions for better insights, Landscape of User Research methods
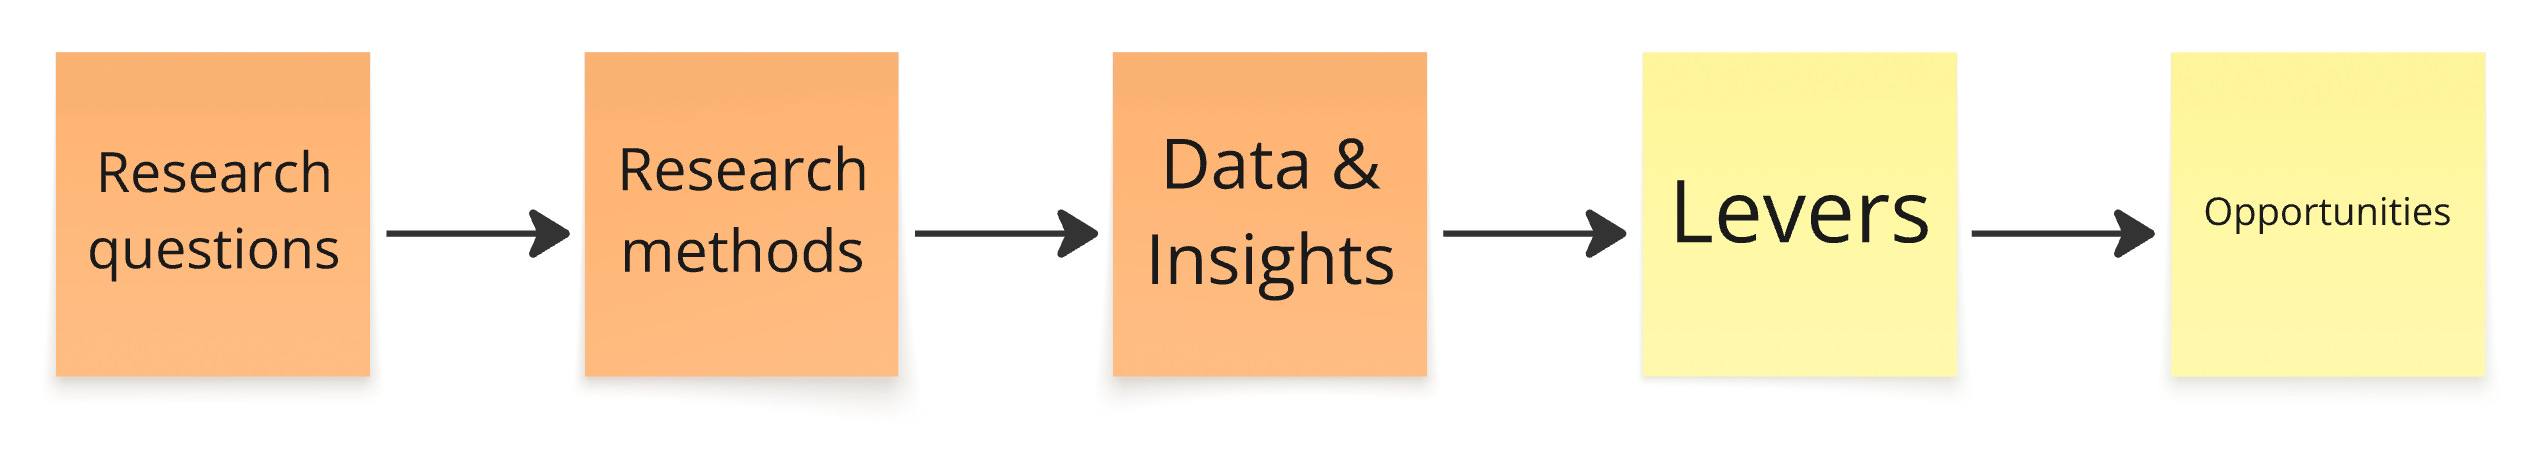
Now that we have basic context, let’s look at the first 3 steps: Research questions, Research methods and Data & Insights.
As I said, everything in this chapter takes place in that first Problem Discovery Diamond. This next framework by Christian Rohrer (NNgroup) is for that first half of that first diamond: It will help us find problems to solve.
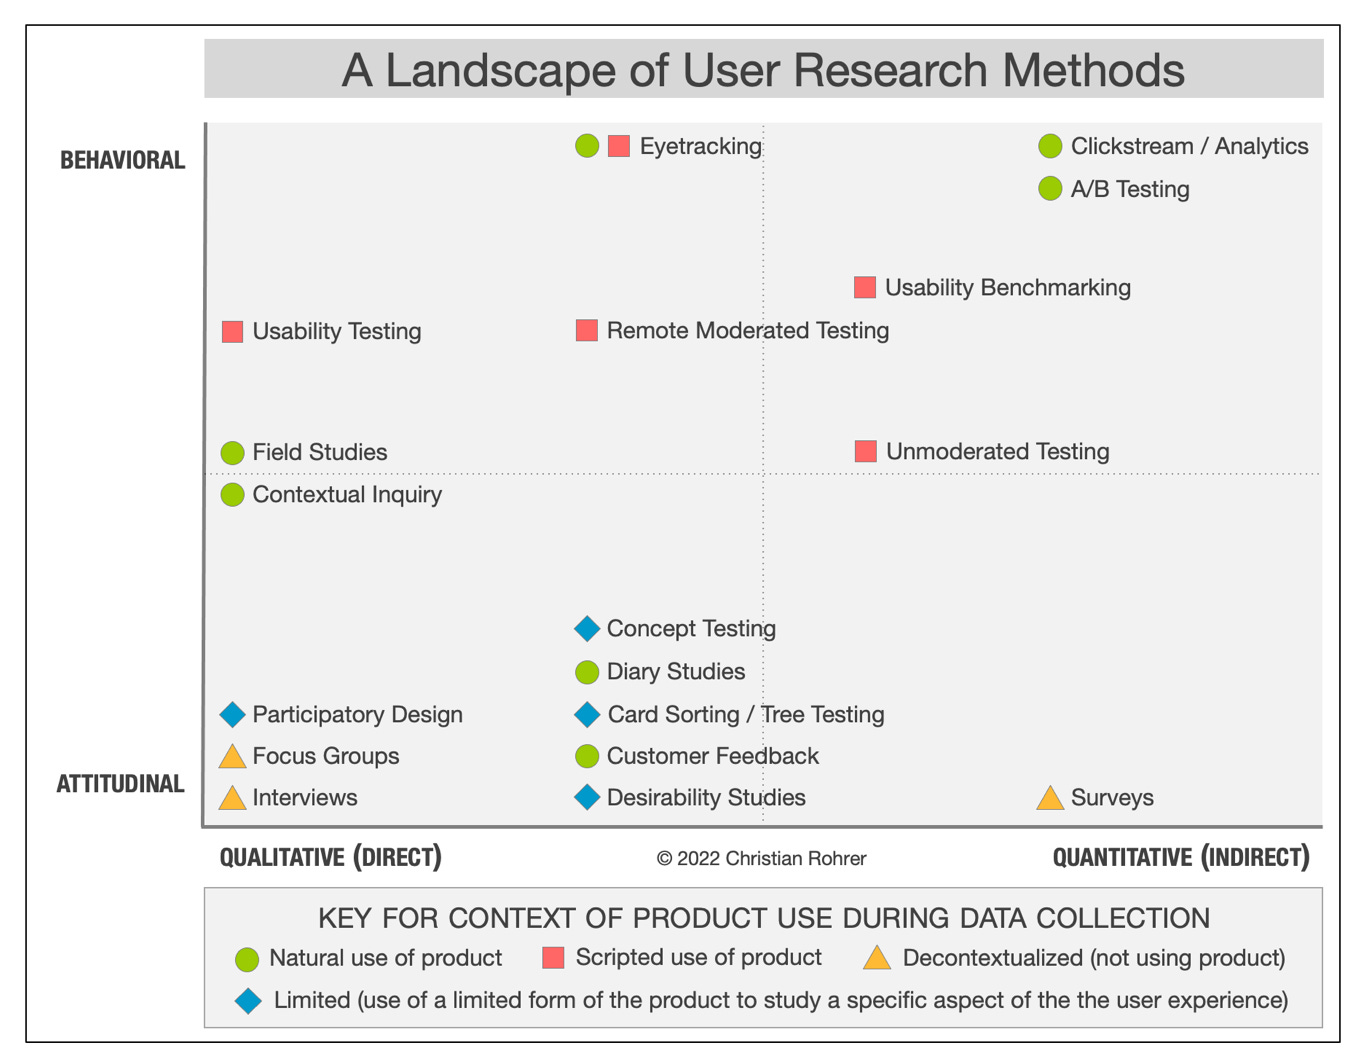
Source: NNgroup
Just look at this three-dimensional beast. It looks a little complex, but we’re going to ignore some parts of this framework for simplicity’s sake.
This is going to be a beefy one, but if you REALLY get what’s conveyed here you’ll have an easier time understanding the things coming up later.
Stick through this part, and the rest will be a breeze.
What’s going on
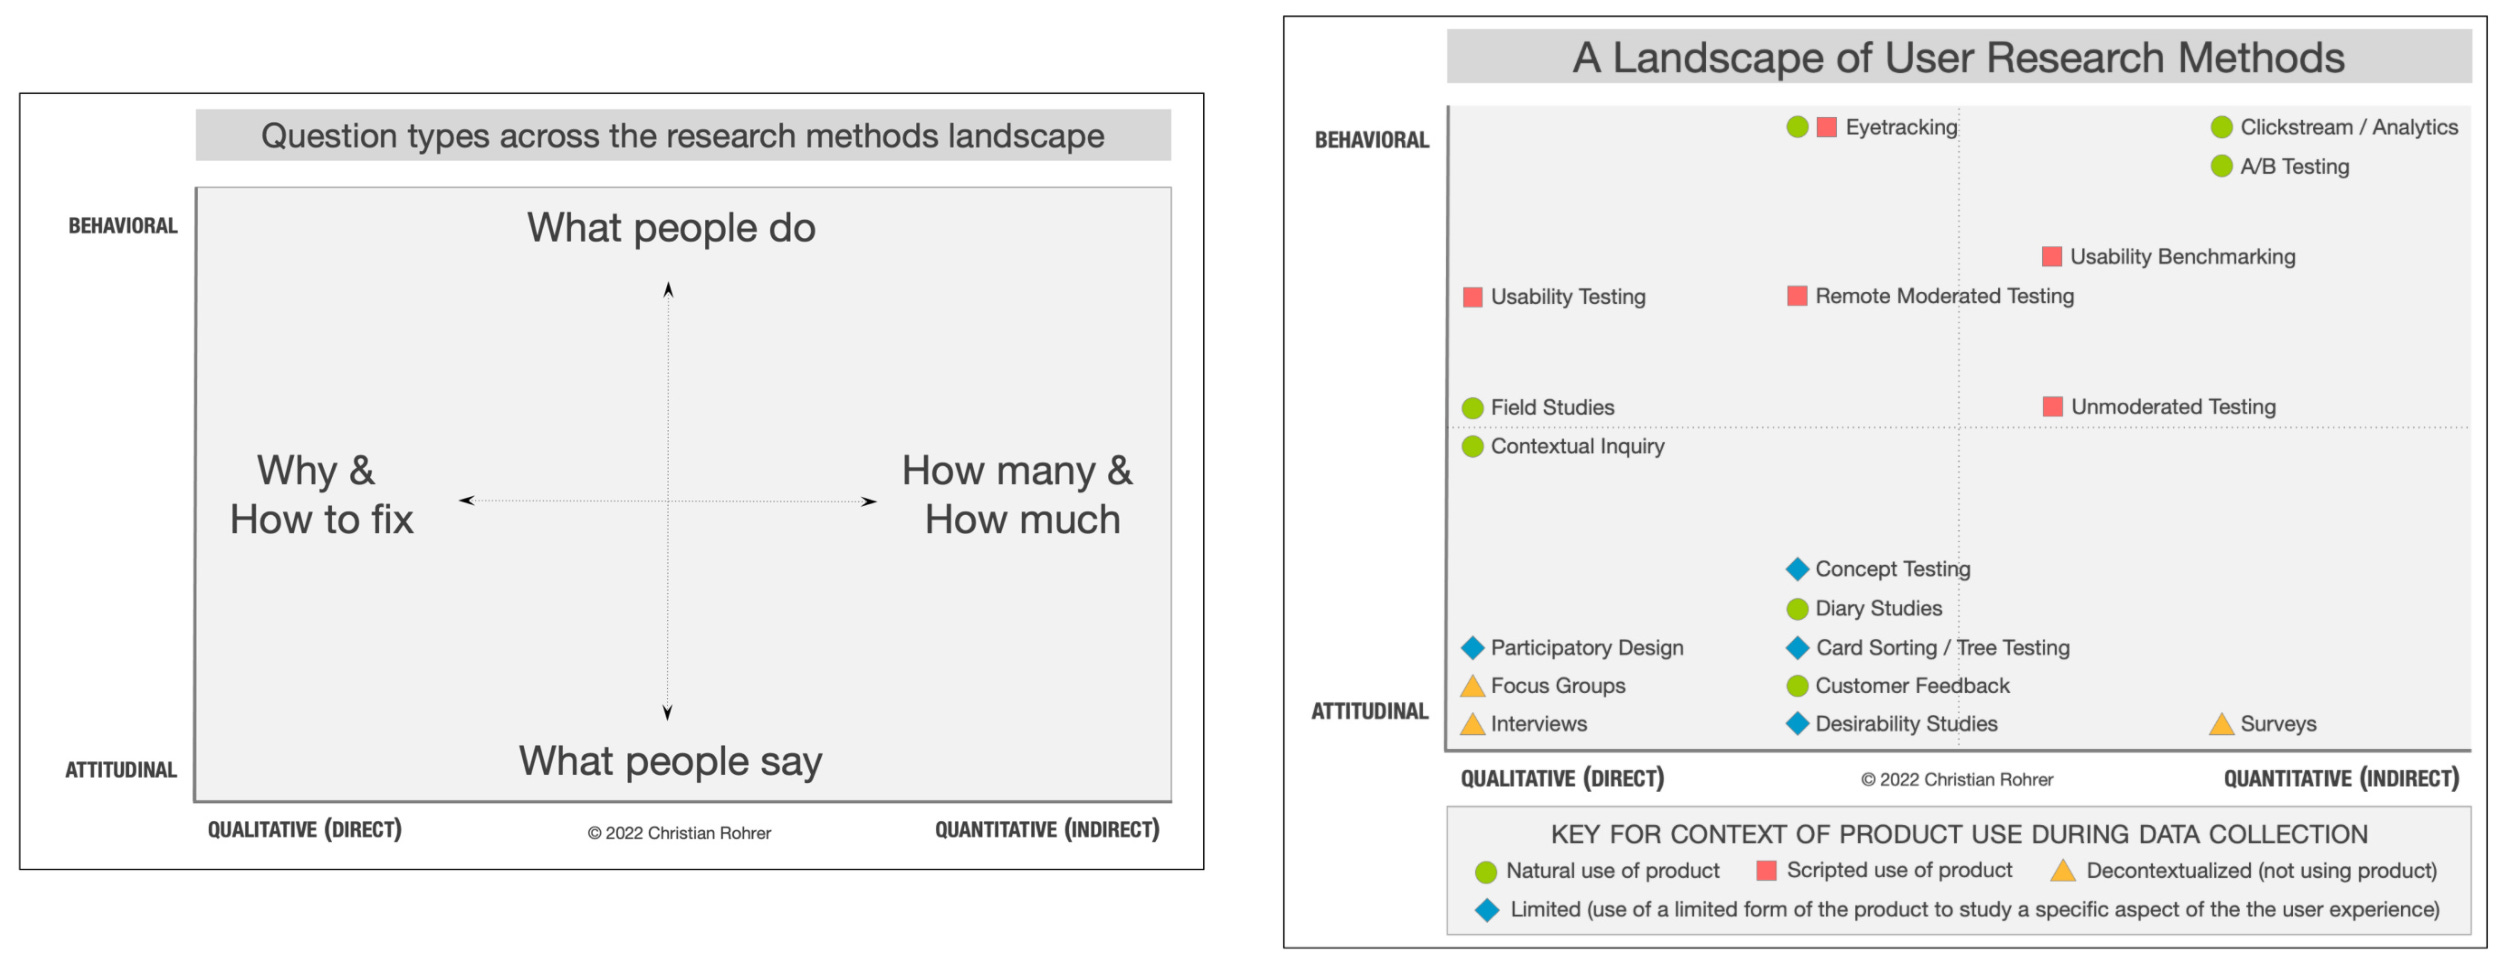
It’s basically “just” a categorisation of research methods you can use. 4 areas:
Behavioural & Qualitative (top left)
Behavioural & Quantitative (top right)
Attitudinal & Quantitative (bottom left)
Attitudinal & Quantitative (bottom right)
An explanation of these are in the next bit. We’ll ignore Context of use (the colour-y and shape-y part), for now.
The area in which a research method sits is conveniently also the type of data it collects. So Usability Testing sits in the top left area, which means it collects Behavioural and Qualitative data. We’ll get to what that means and why that matters soon.
Even though this visual is about research methods, the real power is in the research questions.
I think it can be a trap to think in research methods (“We’ll use GA4 and Hotjar!”), because just browsing analytics reports or looking at session recordings without a clear research question or goal is like looking for a needle in haystack.
The quality of insight you’re able to extract from data, is generally only as good as the quality of the research question you’re asking. You need to ask better questions, which is what the second visual of this framework helps you with and where the real value is.
The value for us in practice
This framework helps you:
Ask better research questions
Pick the right tool for the job
1. Ask better research questions
Source: NNgroup
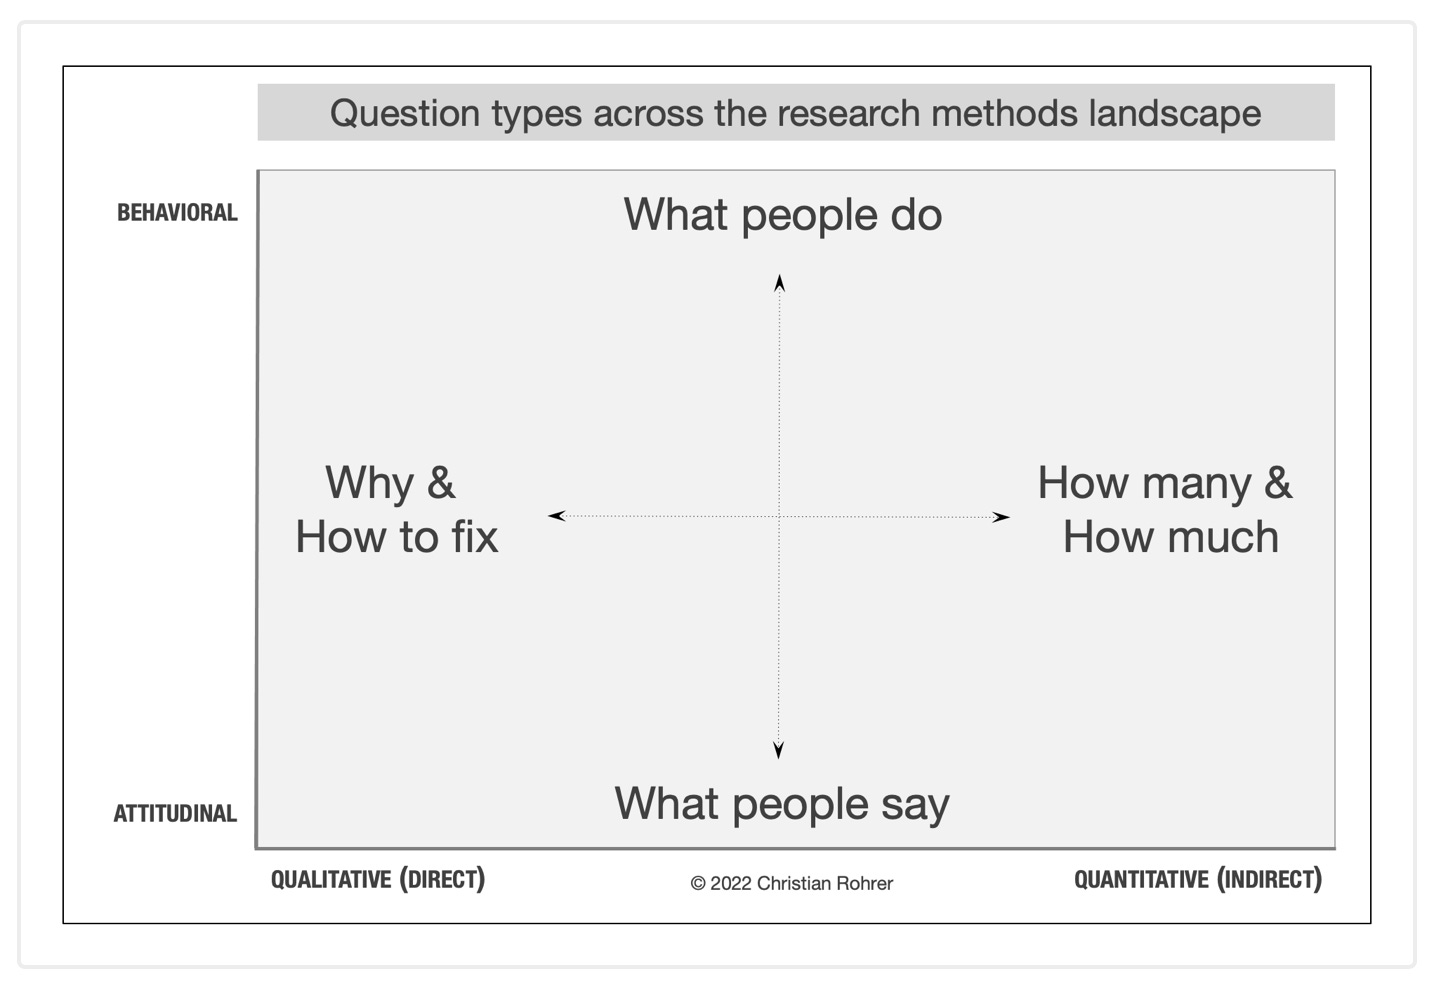
This second version follows the same 4 area categorisation as the first one, but looks at questions instead of methods.
This is where it gets good, because this tells you what kind of questions each method can help you answer:
Behavioural data = What people do questions
Attitudinal data = What people say questions
Qualitative data = Why & How to fix questions
Quantitative data = How many & How much questions
Which equals what type of insight you’re getting, which is what we’re REALLY interested in. More extensive explanation below: feel free to skip if you’re already 100% fluent in this.
SKIP if 100% fluent: The type of insight your getting from
Behavioural vs Attitudinal & Qual vs QuantDo you want facts or opinions? Behavioural vs Attitudinal
These are questions that try to figure out What people do vs What people say.
I’m sure you are very aware that what people say they do vs what they actually do are two very different things. Do you want objective evidence of whether something is happening, and how? Bypassing biases, social desirabilities and whatnot? Then you’ll likely need a What people do question. Users are paying for your product, or they are not. That’s behavioural.
Sometimes those biases and social desirabilities is exactly what you’re interested in. You want insight in motivations, thoughts or opinions. You’ll need a What people say question. Users talking about what style of furniture they like. That’s attitudinal.
Do you want to observe directly or indirectly? Qualitative vs Quantitative
These are questions that try to figure out the Why & How to fix vs the How many & How much.
Qualitative vs quantitative tends to be seen as written text / spoken words (qualitative) vs calculated numbers (quantitative). That’s not entirely wrong but it can get a little muddy. As mentioned in the article, the distinction is clearer if we categorise these as direct (qualitative) vs indirect (quantitative).
Do you want to be able to ask follow-ups or change direction based on what the user is telling or showing you, so you need to be there in the room to observe it directly as it happens? Then that’s likely a qualitative question. These tend to be the Why? or How do we fix this? kind of questions.
If you don’t need to be there as it happens then that’s likely a quantitative question. These are questions that can be answered indirectly, like checking your analytics tool or survey results. The observation already happened instrumentally (at scale) without you being there. Because of that, these questions tend to be the How many / much? kind of questions.
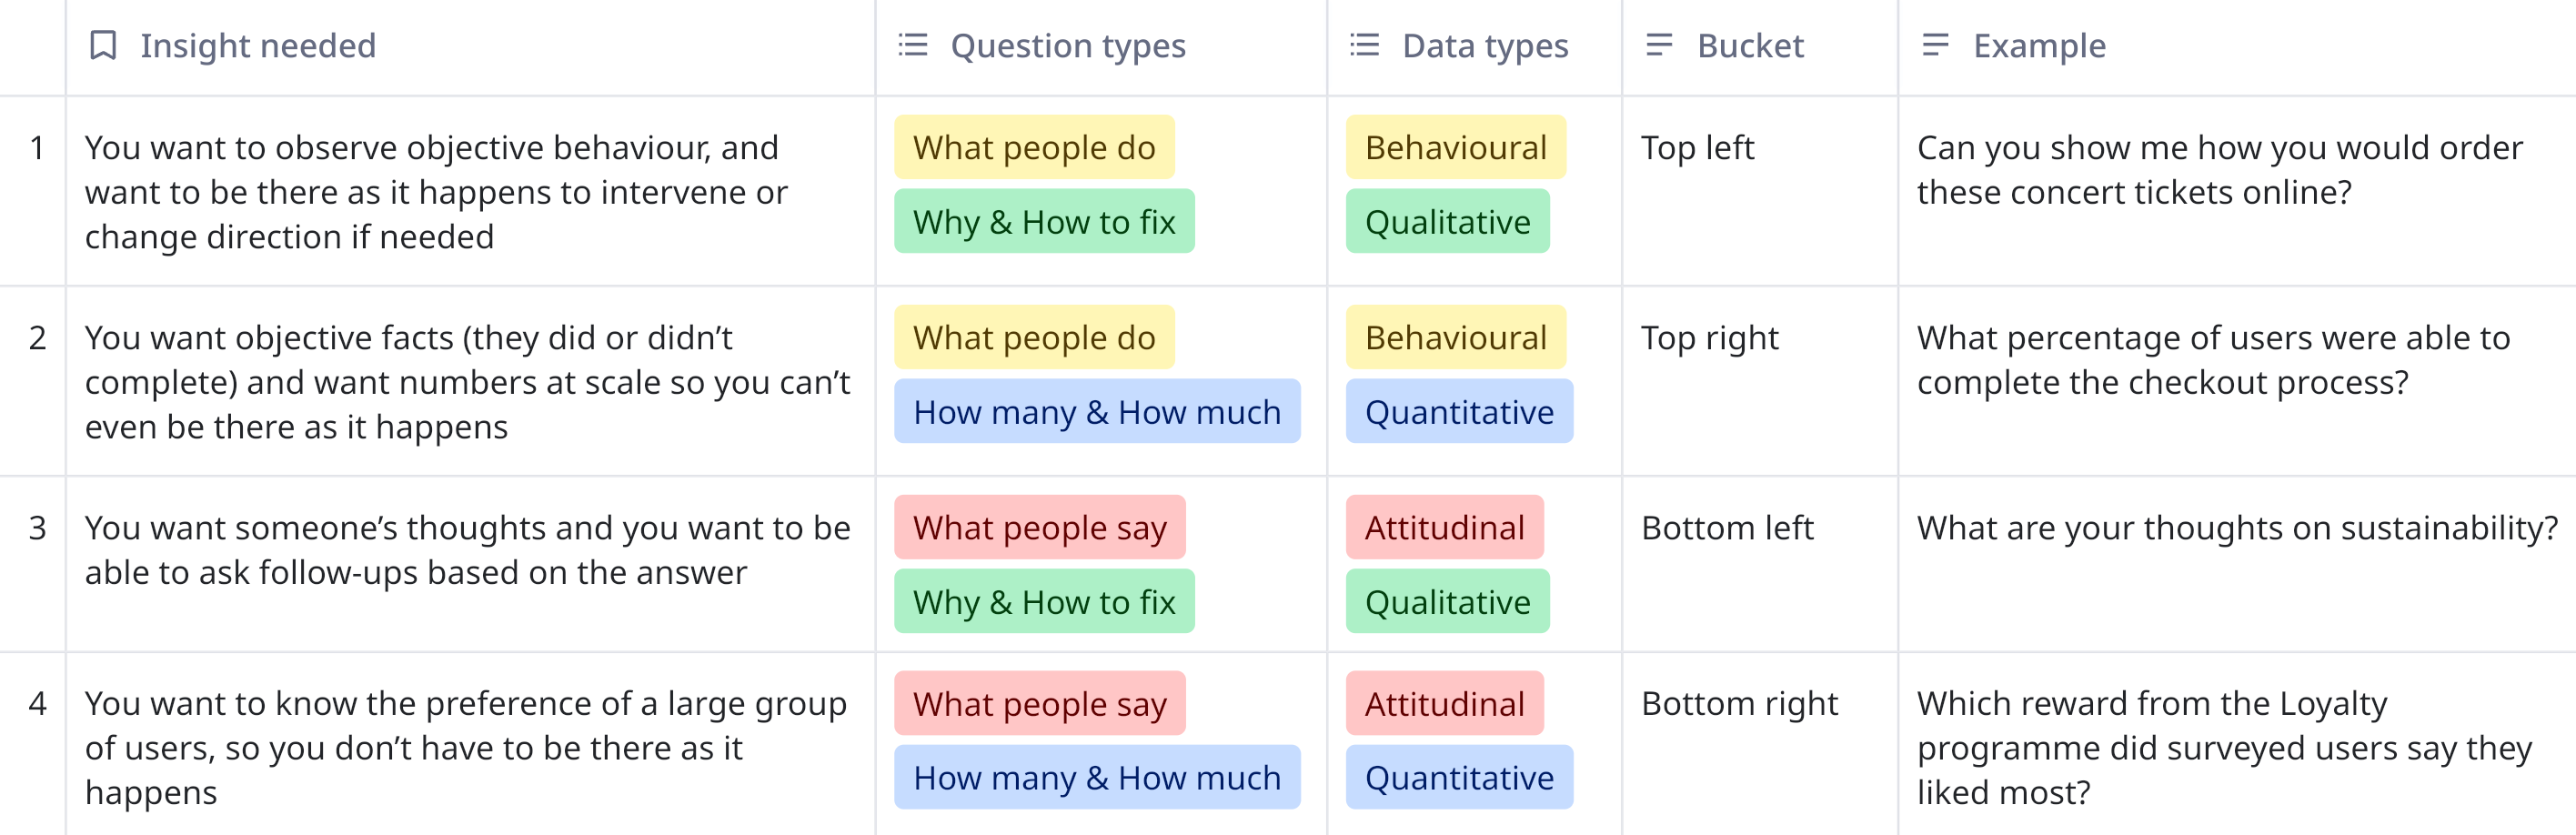
Thinking with the end in mind (the insight you need) and seeing your four options side by side makes it way easier to ask better research questions.
2. Pick the right tool for the job
There is a reason why we spent some extra time on getting the types of questions and insights right, because picking the right tool for the job is now super easy.
Instead of deploying a research method and hoping for the best, you can now work backwards from the end. From insight to question to data to method:

Which of the 4 types of insight do I need?
What kind of question will help me surface that?
What type of data do I need?
Which research method or tool can help me deliver that? Which area should I choose from?
OK GREAT, that took longer than I expected. It was necessary though. You’ll recognise the things we discussed here throughout the rest of this guide, so it was time well spent.
Still with me? Good news: things are going to be a bit easier from here on out.
3. Make sense of insights: identify the patterns, Levers Framework
Next up: Levers.
Levers are fun because they can be used in two ways. They can be used both as a starting point to find problems to solve (the first half of the Diamond), and as a means to make sense of the things you found (the second half of the diamond). You’ll see shortly.
This framework from the agency Conversion is relatively new to the scene (2022?) and I LOVE it. You’ll see that there are many things out there that have a different name but do roughly the same thing: themes, heuristics, optimisation strategies etc.

Source: Conversion
What’s going on
The simplest way to put it is that levers are like a language.
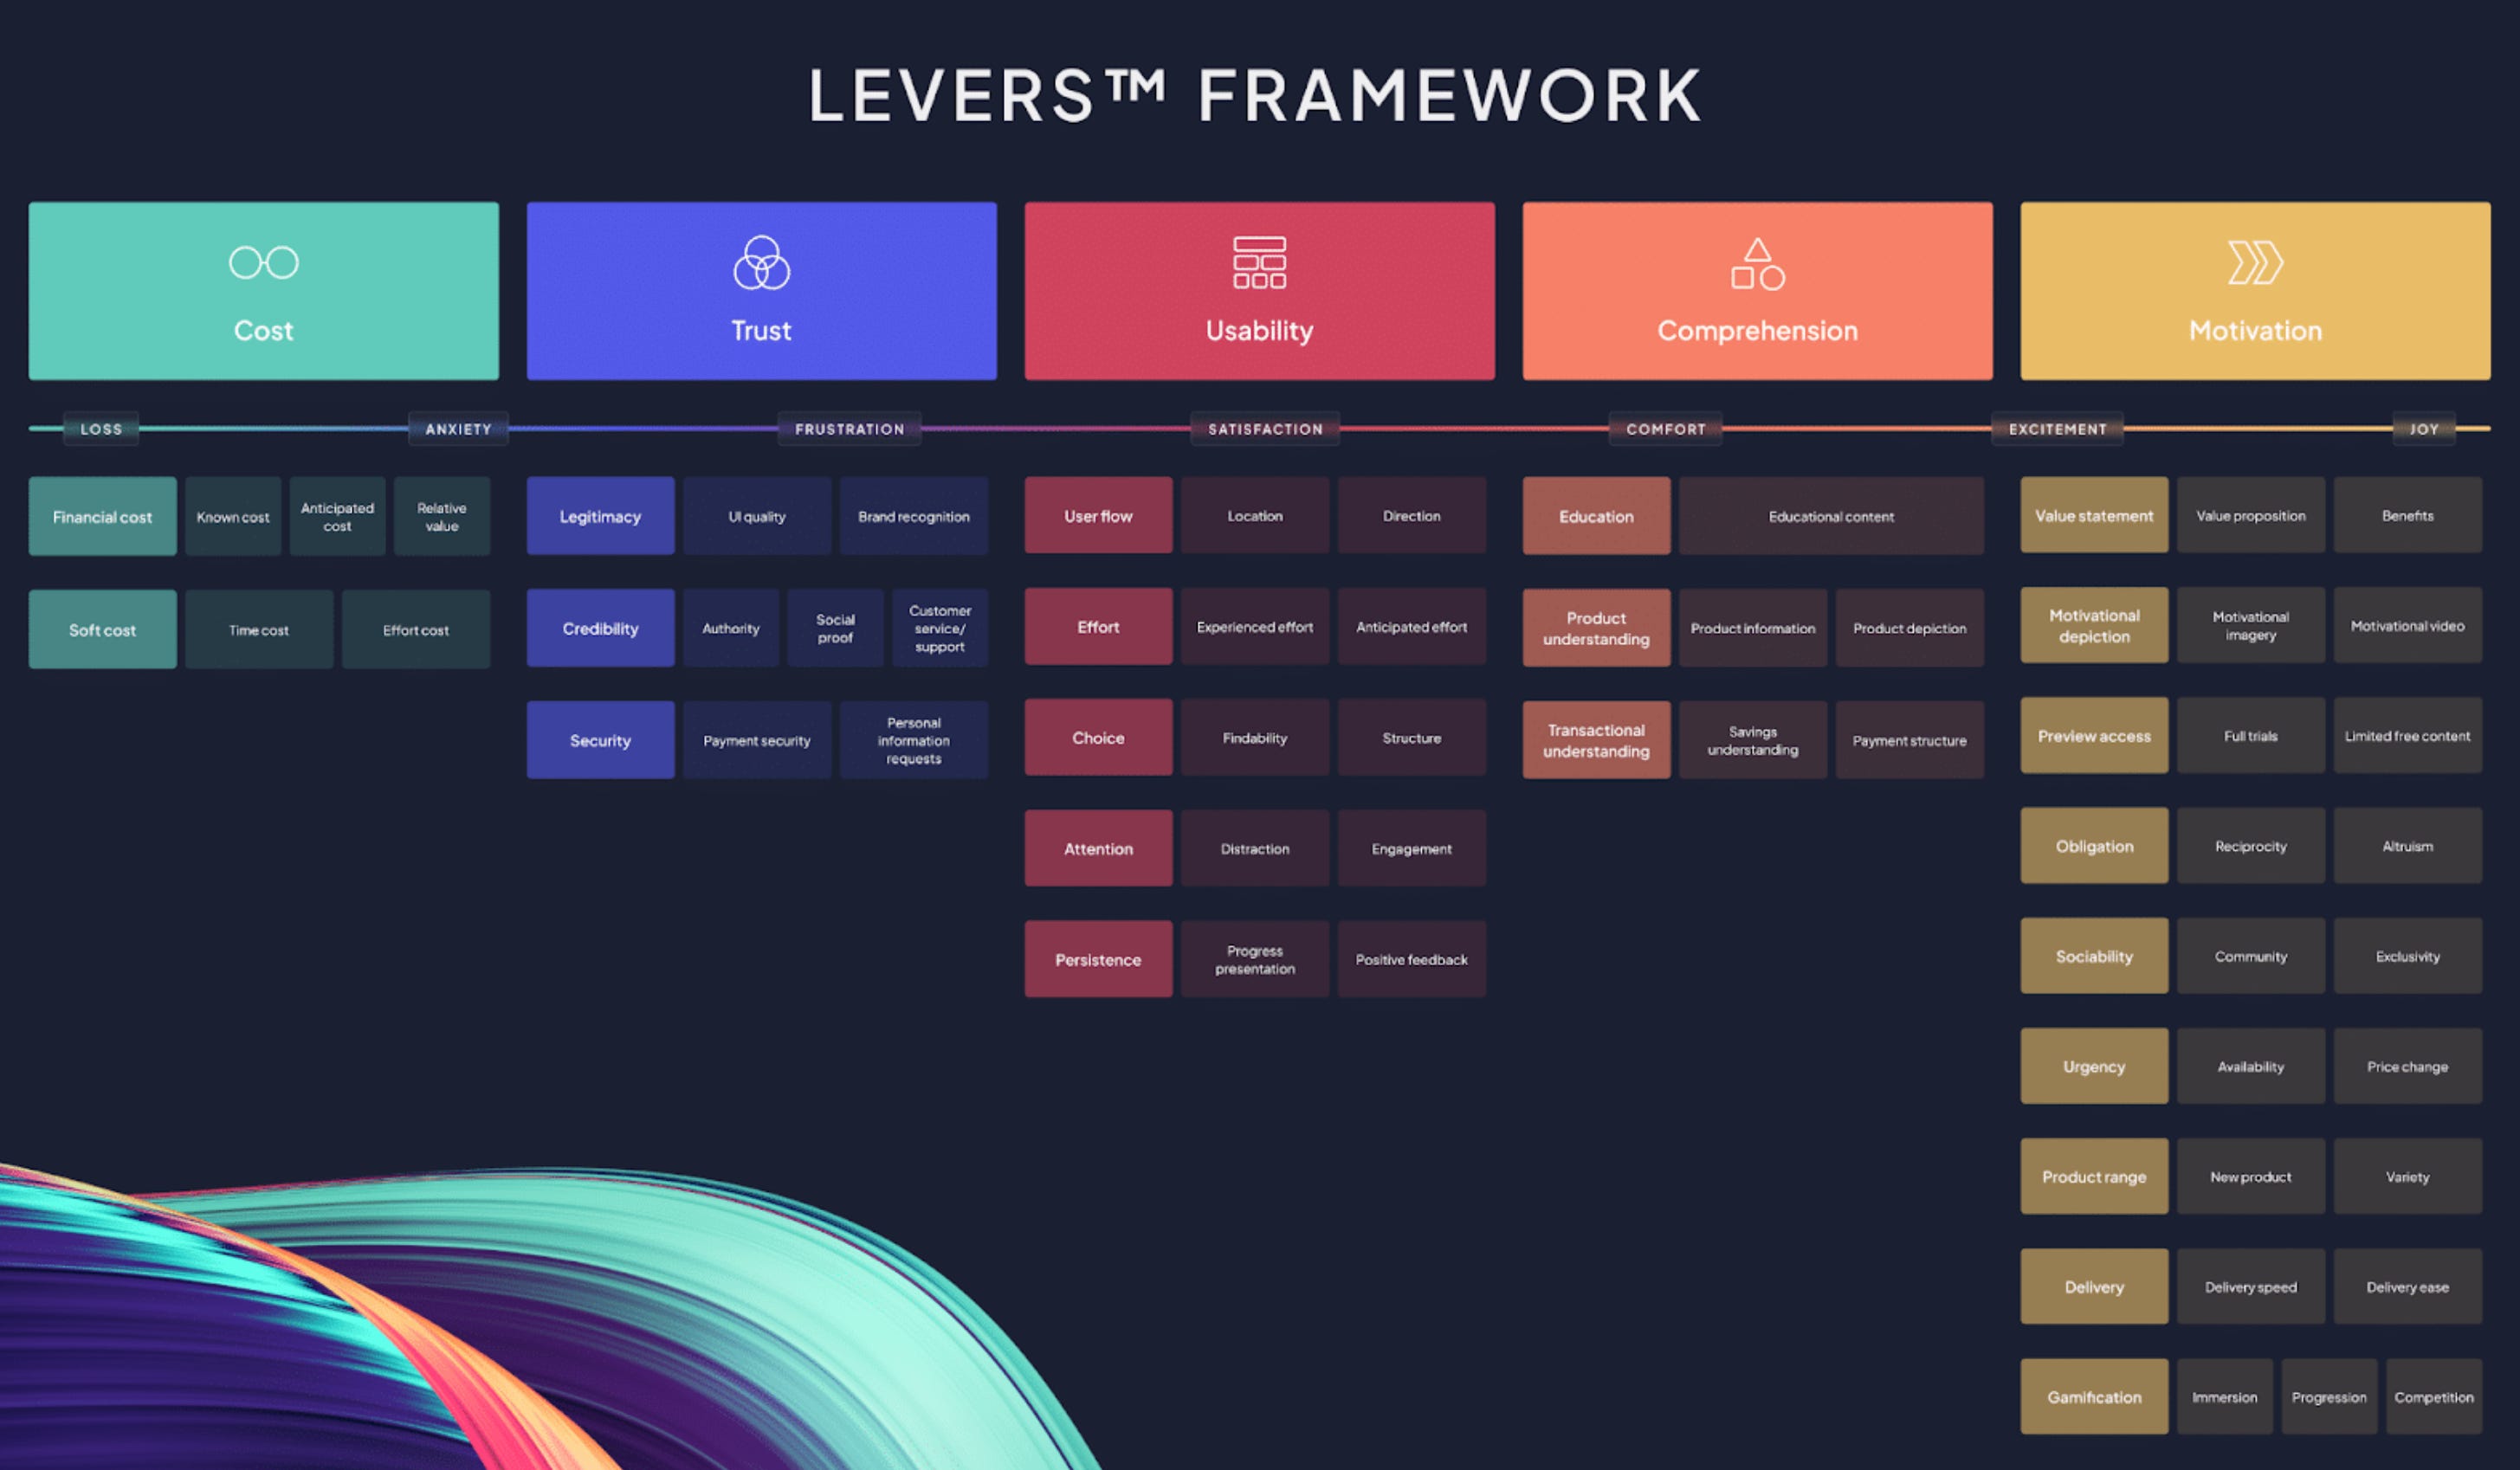
It names all the different parts that when combined, form The User Experience (see top row: Cost, Trust, Usability, Comprehension, Motivation and all its subparts).
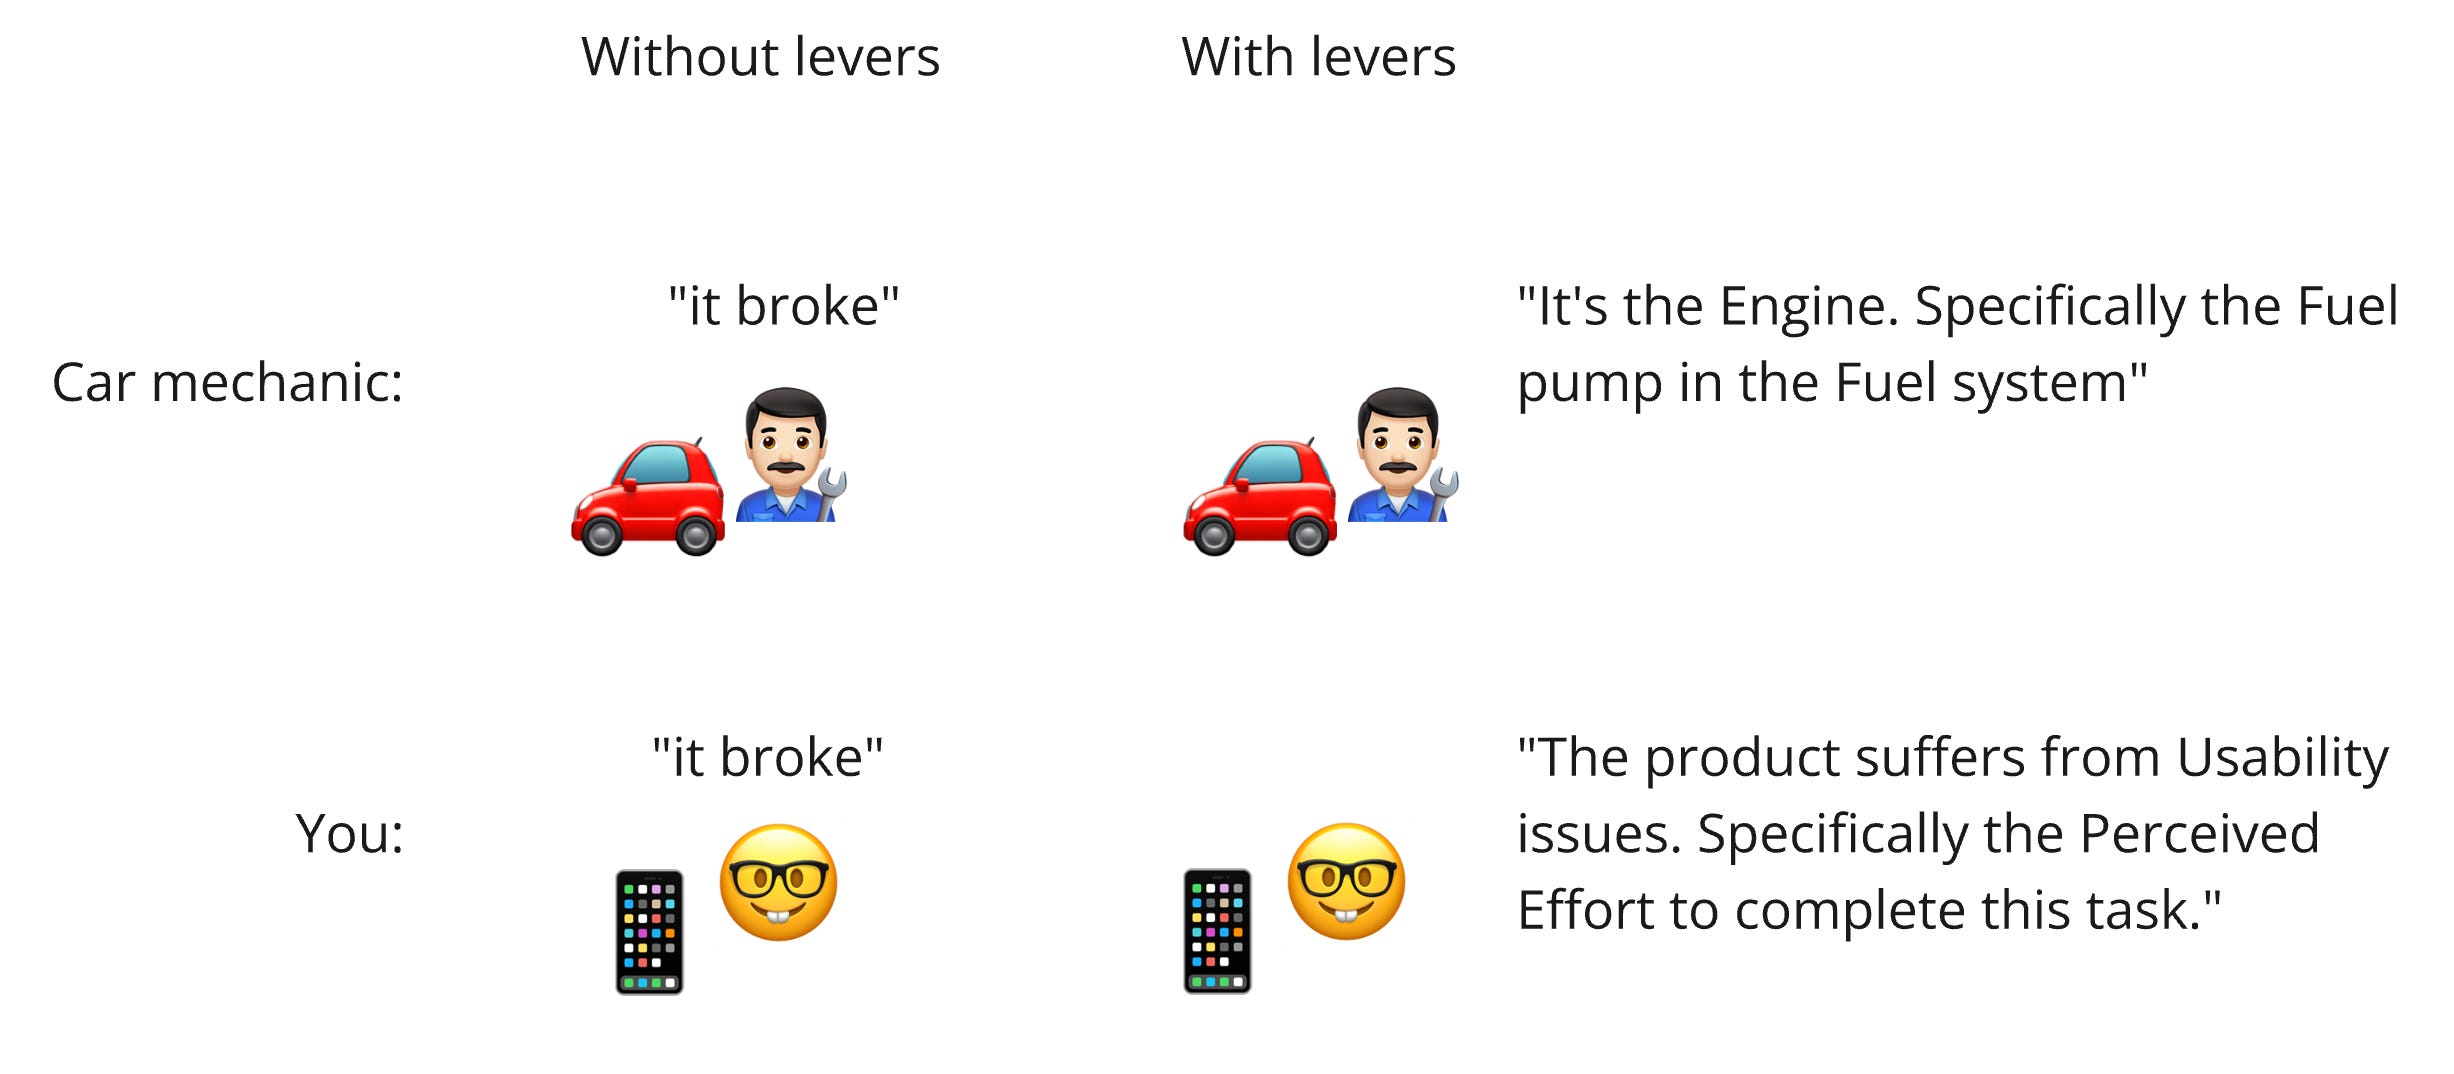
Just like how The Engine, Chassis, Transmission, Electronics and Interior combined form The Car.
It gives you a richer vocabulary, which allows you to articulate more specifically. The more specifically you can articulate what is going on, the easier it is going to be for you to take effective action.
Just like the mechanic who can point to the Fuel pump instead of the entire car as the problem and replace just that part, you can point to a sublever of Usability instead of the app as the problem and focus on just that lever.
The value for us in practice
The benefit of a richer vocabulary:
Levers help you identify patterns and form a discovery strategy
Levers are a great starting point for research questions
1. Levers help you identify patterns and form a discovery strategy
That ability to specifically articulate what the problem is (Usability > Effort > Anticipated effort VS app broke) also has a long-term benefit next to just being able to take more effective action.
You will start seeing patterns across all your data & insights. These patterns can in turn be used to help form a broader discovery strategy:
“The Comprehension lever worked really well for X part of the product, let’s see if it also works for Y part of the product”
“The last 5 attempts at improving the Comprehension lever didn’t yield positive results, let’s move on to a different lever”
“Looking at last month’s feedback, we see a shift in feedback from the Comprehension lever, to the Usability lever. Let’s allocate some time next quarter to further investigate what’s going on”
It’s the vocabulary that allows you to identify these patterns.
2. Levers are a great starting point for research questions
As we said in the beginning of this part; Levers are not just for making sense of the stuff you found, they can also be a great source of inspiration for research questions.
When starting fresh, figuring out (or ruling out) whether there are any Friction issues is a very decent starting point. You’ll inevitably find more nuanced and detailed stuff as you go, but if you’re starting fresh the point is to get going.
And yes, you can combine this with the Landscape of User Research methods framework if you want. Some examples:
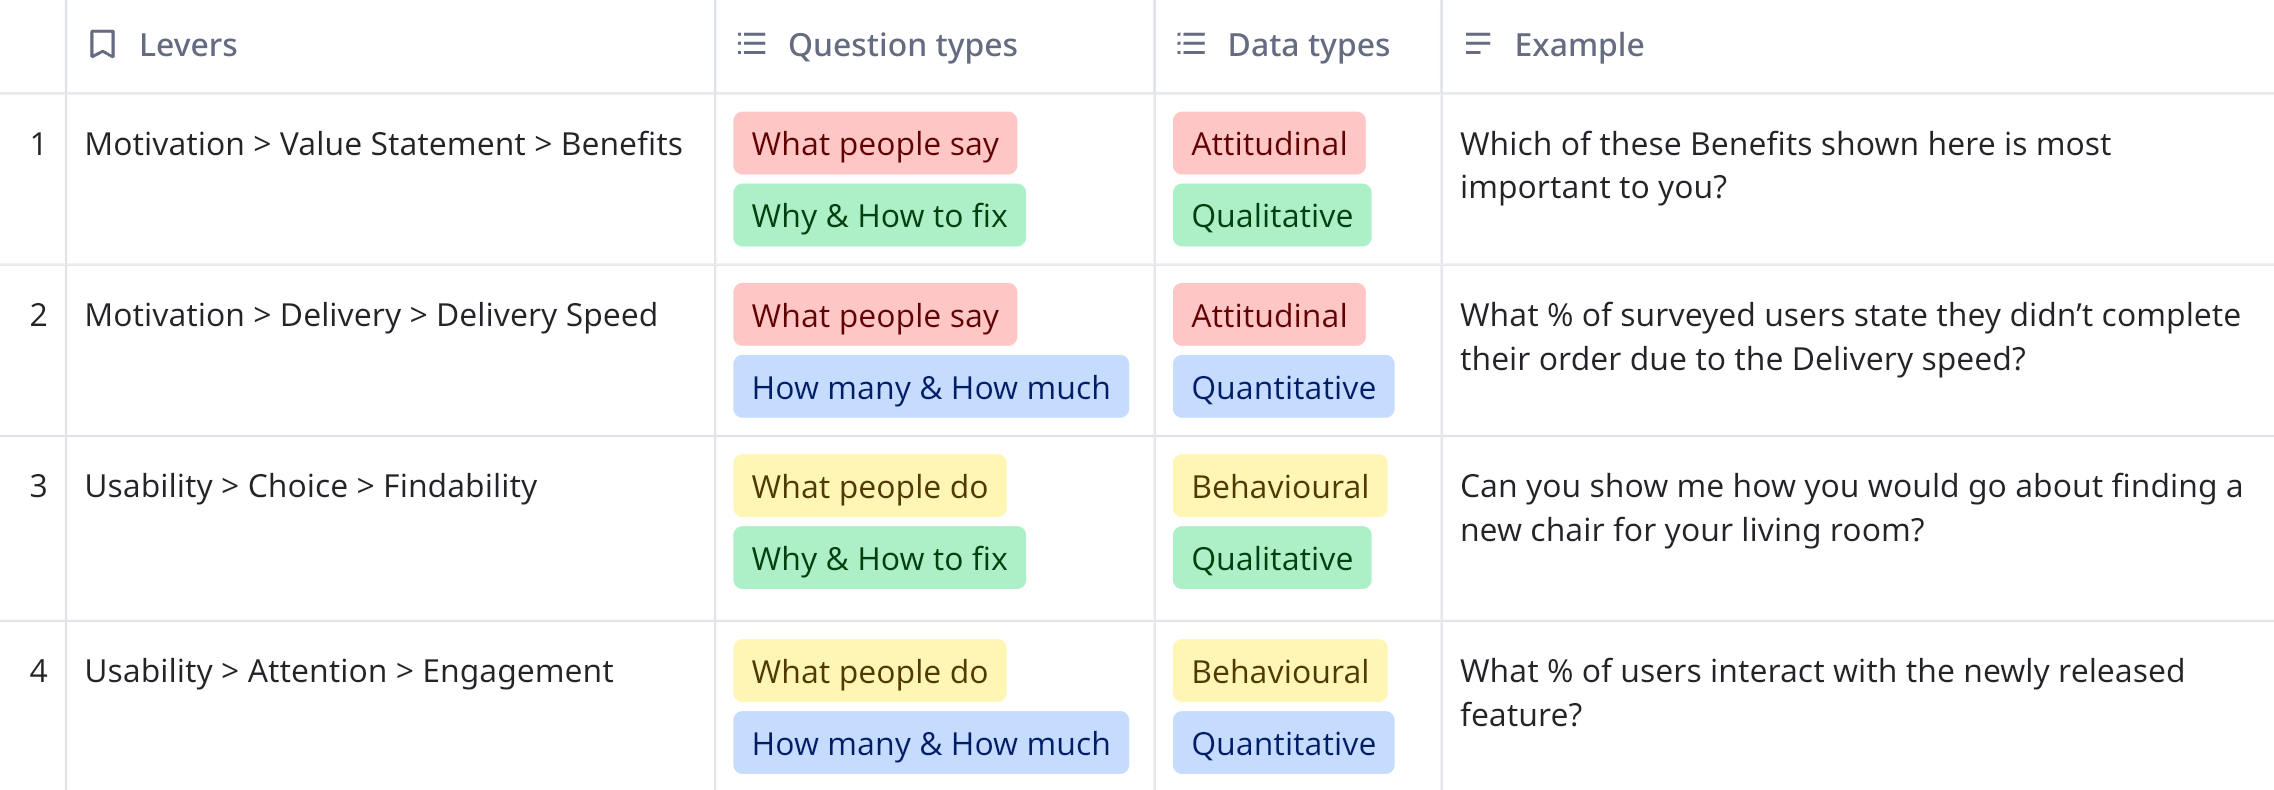
Apart from using this one you can also create your own version of levers. In fact, most orgs I’ve worked with do. Something that clicks with the wider strategy and language already used internally.
You’re also completely free to not use Levers at all. From an operational perspective they’re completely optional: you don’t need them to get the work done, especially if you’re a little more experienced or prefer a more pragmatic approach.
That’s fine. If you have insights indicating that something needs improvement, feel free to just go ahead and fix it. Just know that you won’t profit from any of the benefits we just discussed.
4. Strengthen the signal by stacking your research methods, Atomic Research
Let’s take a closer look at the operational process to tie up everything we talked about so far. Literally.

This next framework by Daniel Pidcock is basically a zoom-in of that first diamond.
Source: Prototypr on Medium
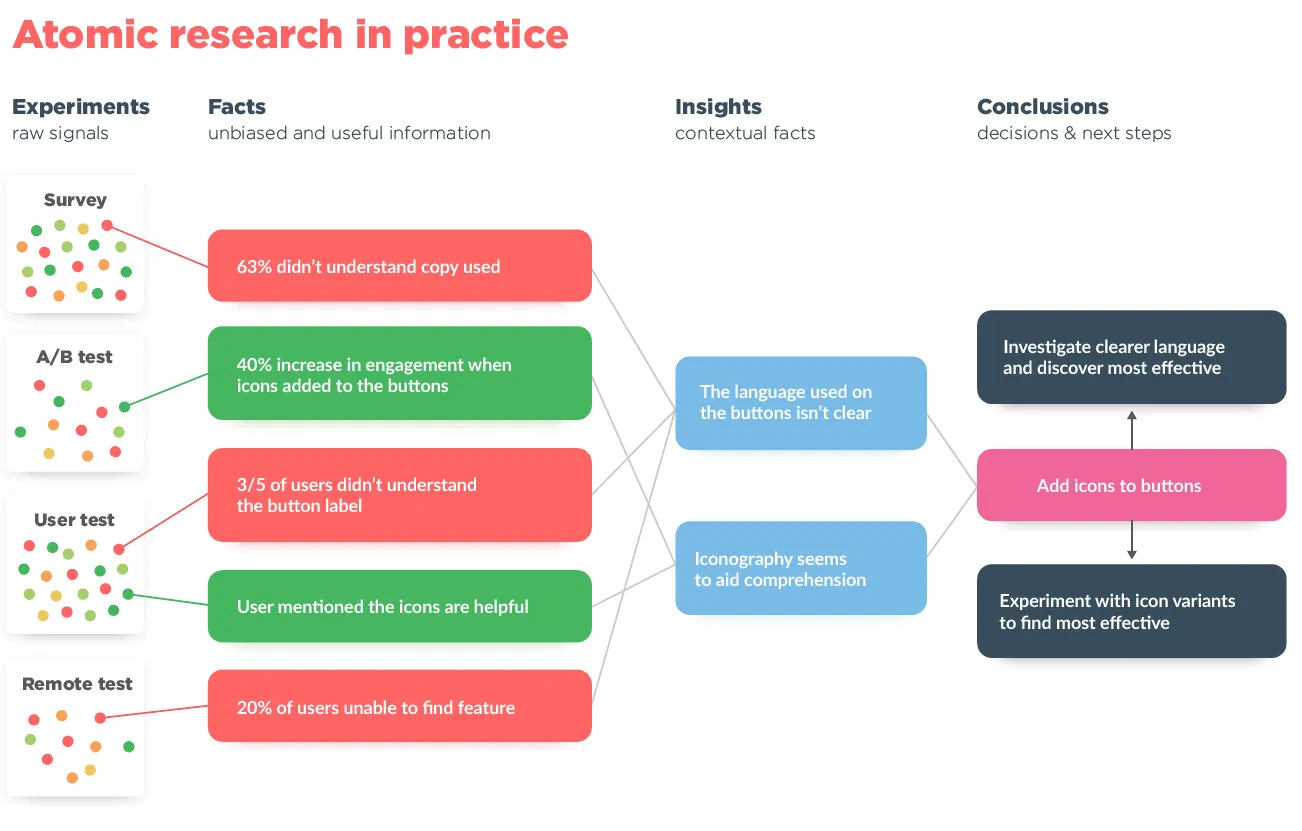
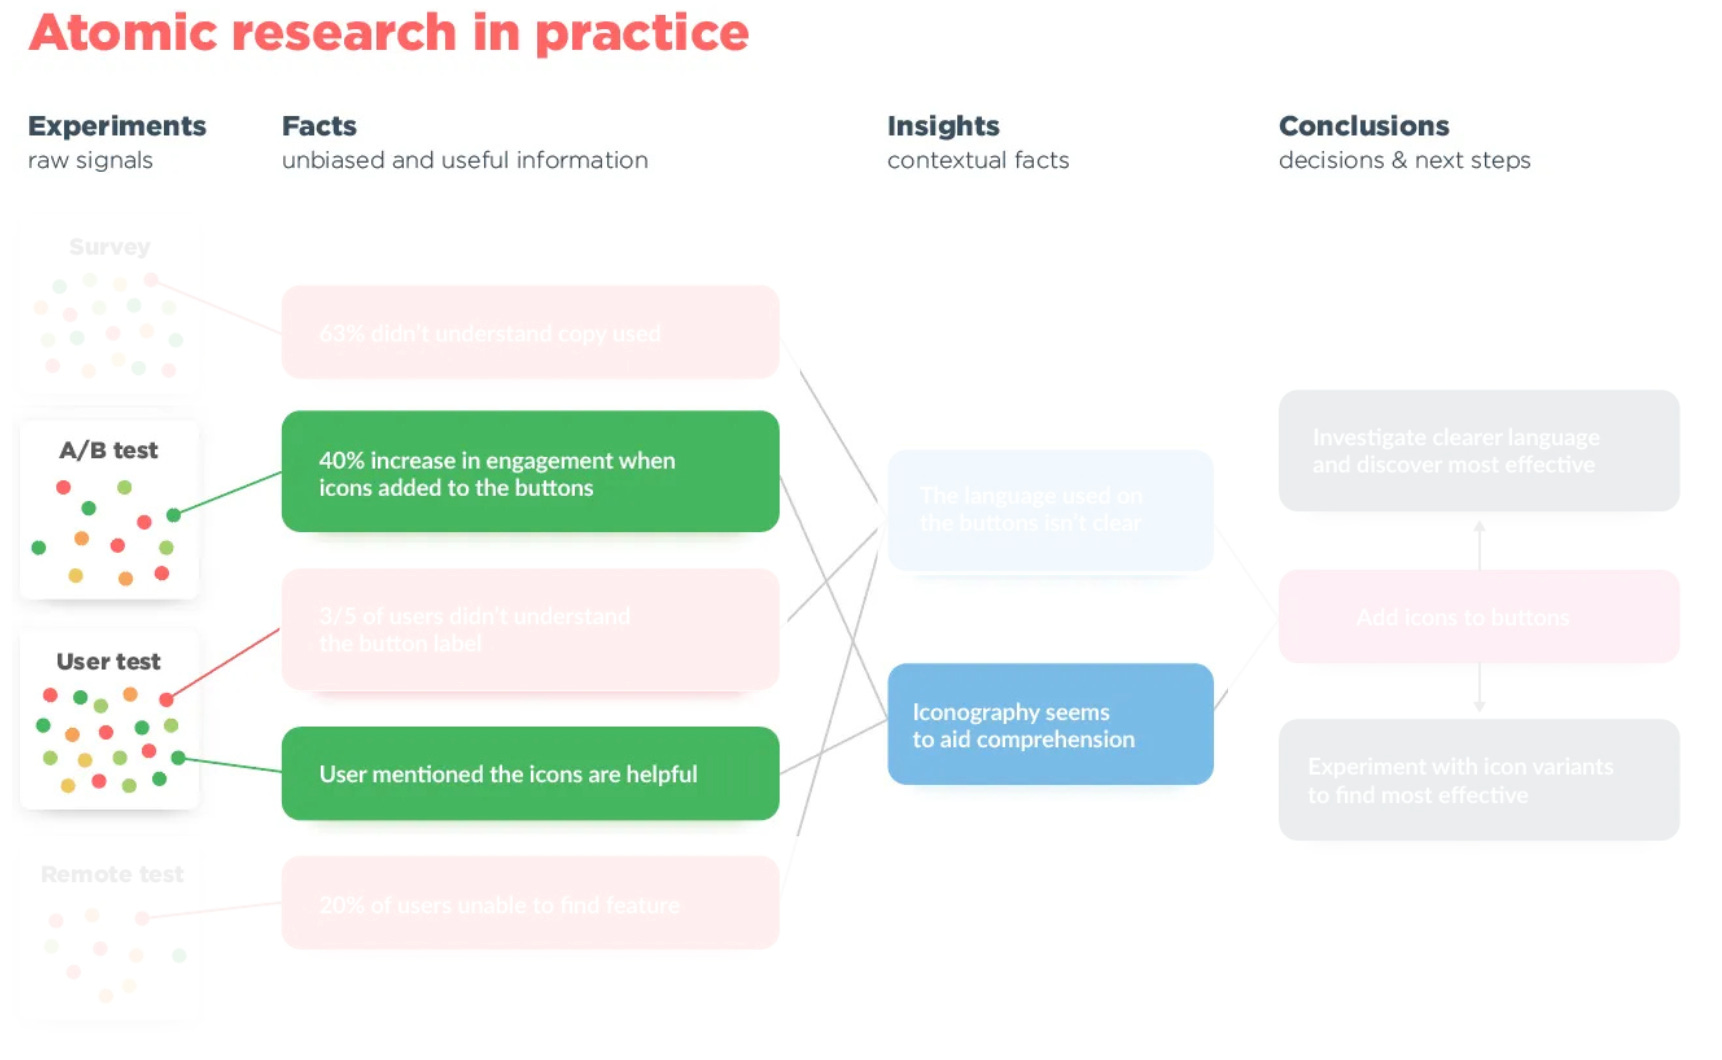
What’s going on
It’s actually not that different than the 5 steps we started this post with, just with slightly different language.
Experiments = Research methods, though experiments is probably a better name if you also consider that things tend to run a little more in loops in practice
Facts = data (not exactly, but no need to nitpick here)
Insights = Insights
Conclusion = what we called solutions in the previous post. Same same.
Research Methods, Levers and Opportunities are missing, but we’ll get to that shortly.
Its power is in the visualisation: the tying concepts together in the many to one relationships.
The value for us in practice
This framework teaches us something vital about the process: you gotta stack your research methods.
1. You gotta stack your research methods
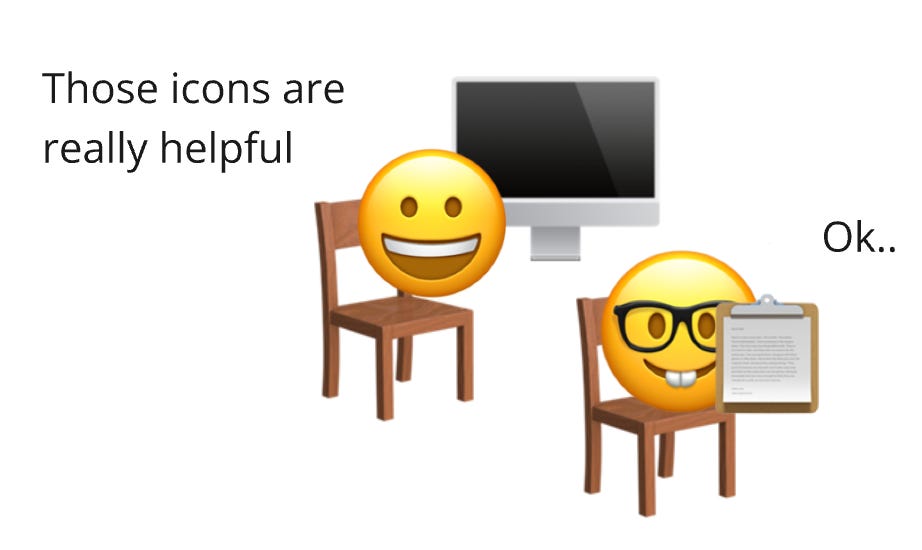
Let’s say you did a user test and the participant mentioned the icons are helpful. It’s one of the many things said during the study; you jot it down and move on.
By itself it’s a nice compliment for the designer, but not a strong signal that indicates you have to take action IMMEDIATELY.
If you were to draw your insights from just the data of this user test, it’s likely this piece of data would’ve made it into an insight.
You base your conclusions on the things that did make it to an insight, ideate solutions, implement them and move on.
In a different month, maybe even in a different team, something different happened.
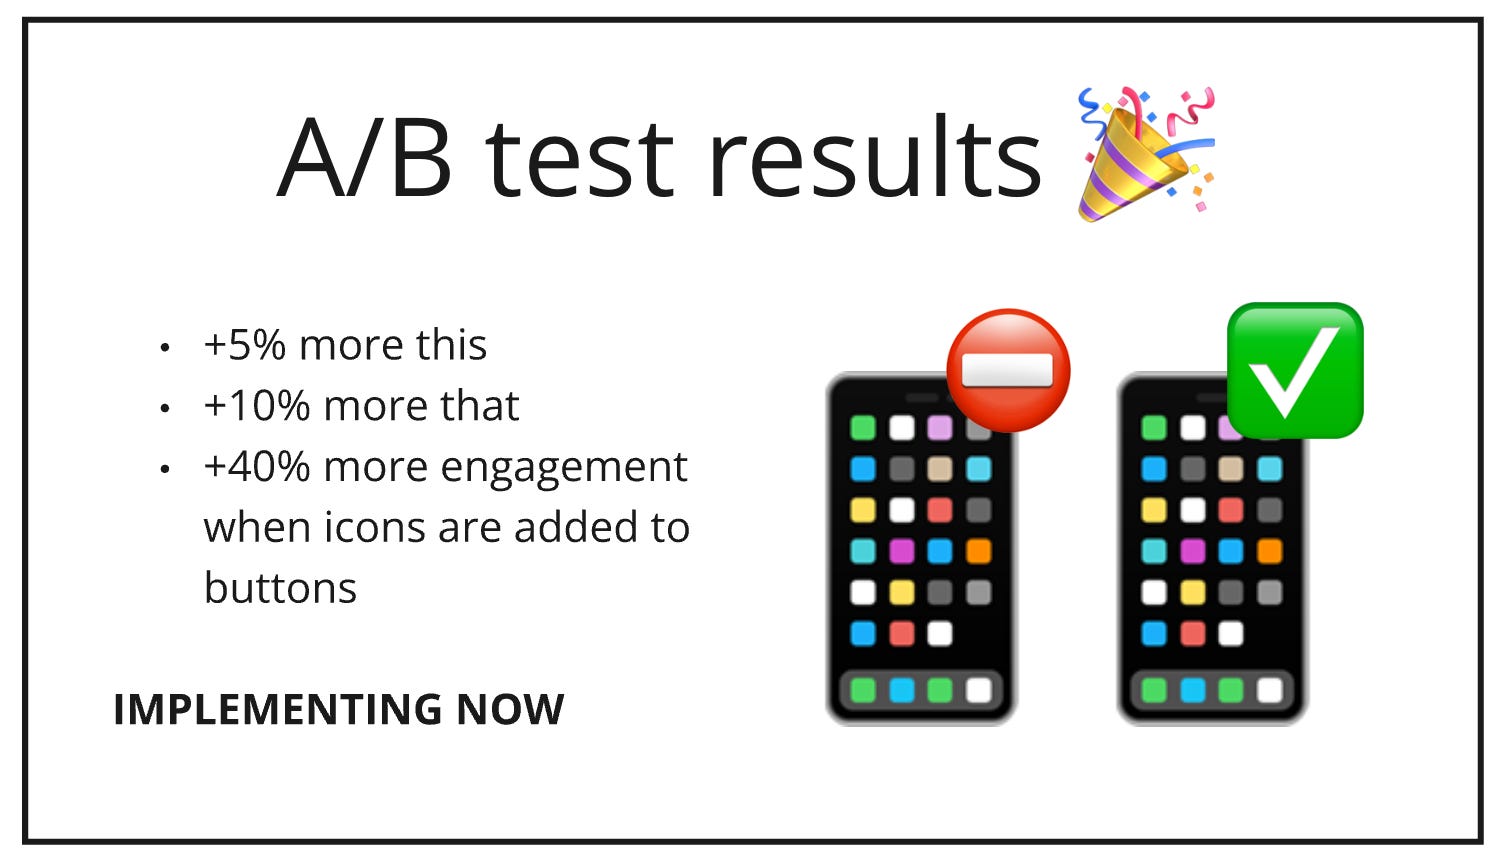
An A/B test was conducted that had a positive impact on all sorts of important goals. It also had a positive impact on engagement: +40% more engagement when icons are added to buttons.
There are now 2 pieces of data signalling that icons are a thing. If you see them together, you’d draw the insight “Iconography seems to aid comprehension”.
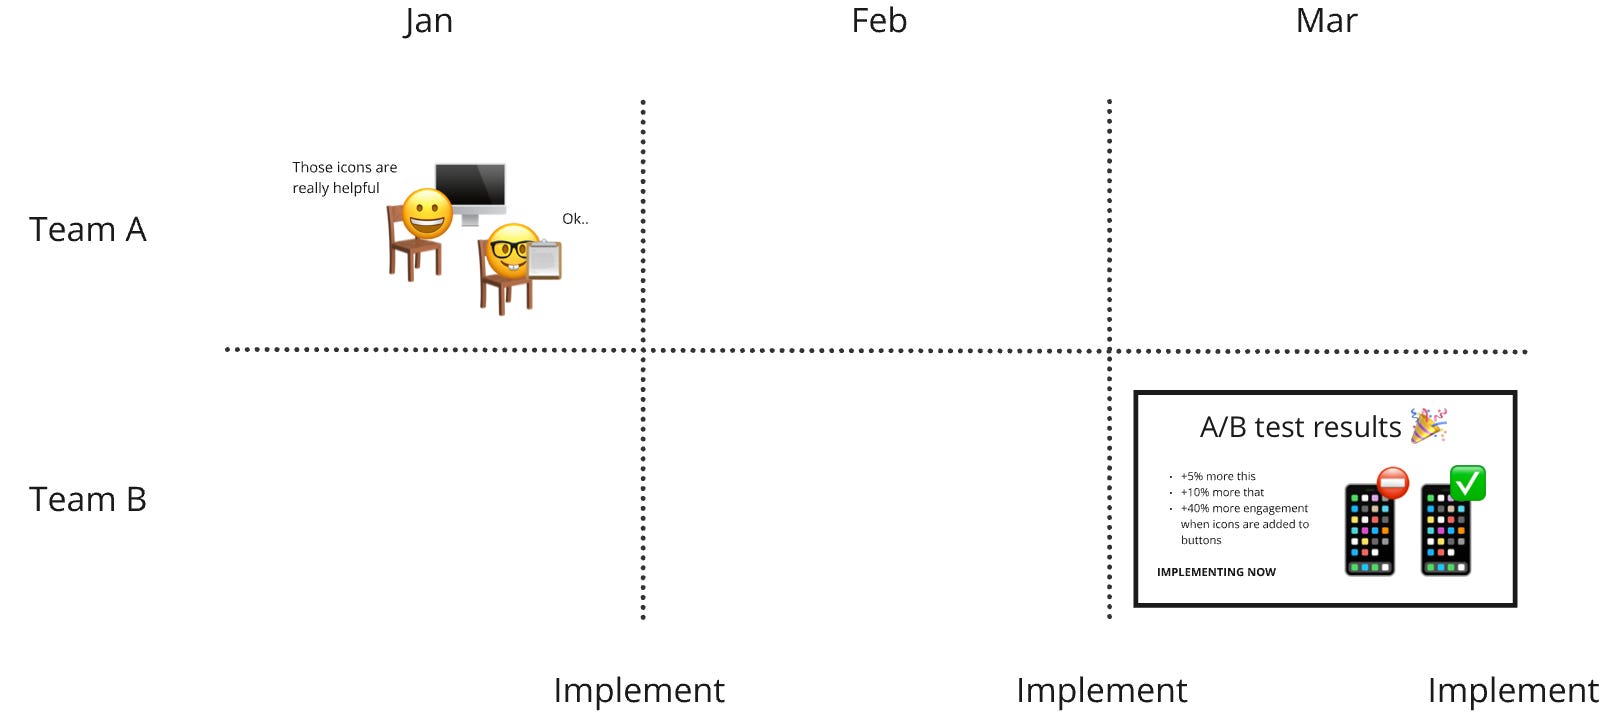
The problem is that they’re never combined because the research methods weren’t stacked; they’re separated by time or even by teams.
You did the user test and implemented all the recommendations of that study at the end of the month. By the time it’s March you’ve moved on to other things and forgot about that participant saying icons are nice.
Stacking your research methods circumvents this. It not only enables you to draw that insight in the first place, it also unlocks signal strength. If you deploy 5 methods and all 5 of them are saying icons are thing, it’s probably a BIG thing. Not only that, different methods collect different types of data (we talked about this: quant vs qual, attitudinal vs behavioural) which are like different pieces of the same puzzle. You need all of them to see the full picture.
This stacking and tying together applies to all steps of the process:
Multiple questions can tie to a single research method: this is likely method that will yield multiple answers
Multiple research methods can tie to a single fact: this is probably a valuable piece of information as it shows up multiple times
Multiple facts can tie to a single insight: this is likely a strong insight
Multiple insights can tie to a single opportunity: this is likely a strong opportunity
Multiple opportunities can tie to a single solution: this solution potentially solves multiple problems at once
More ties = more signals = likely more prio.
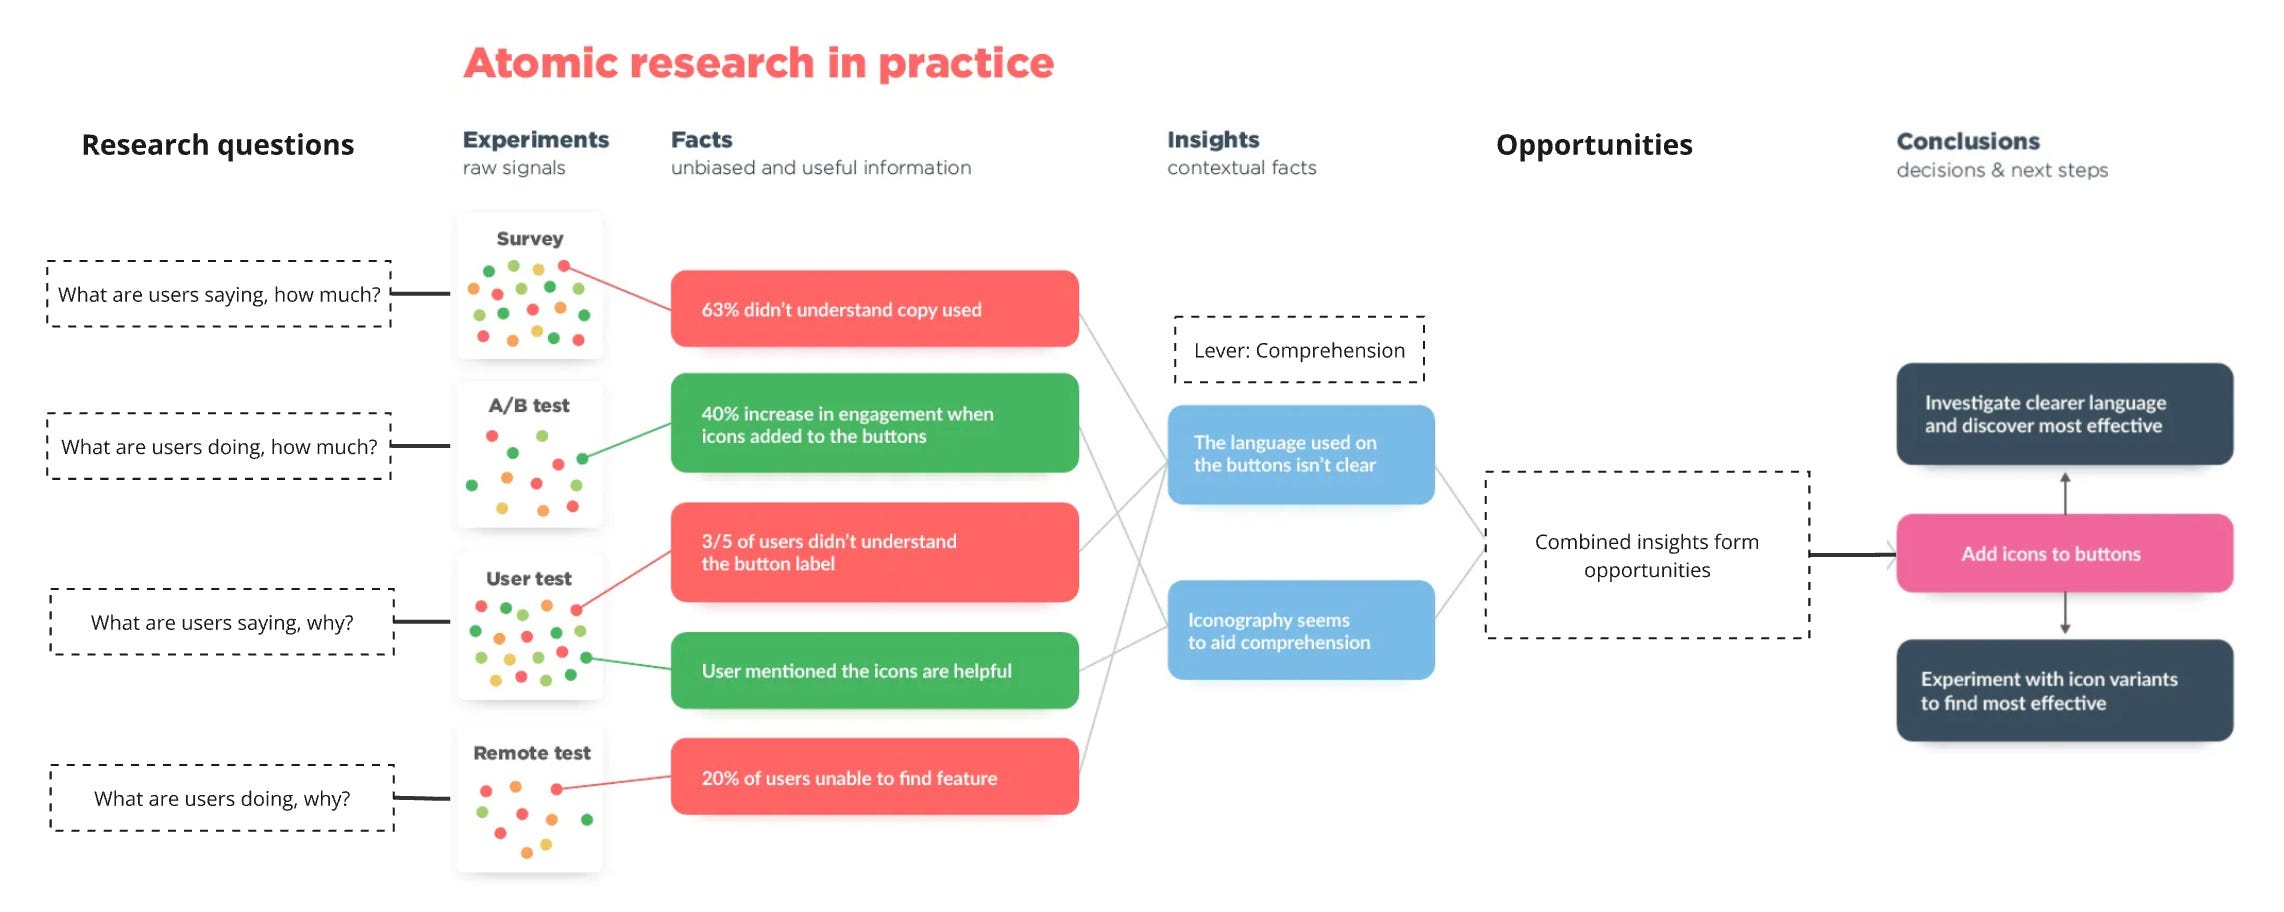
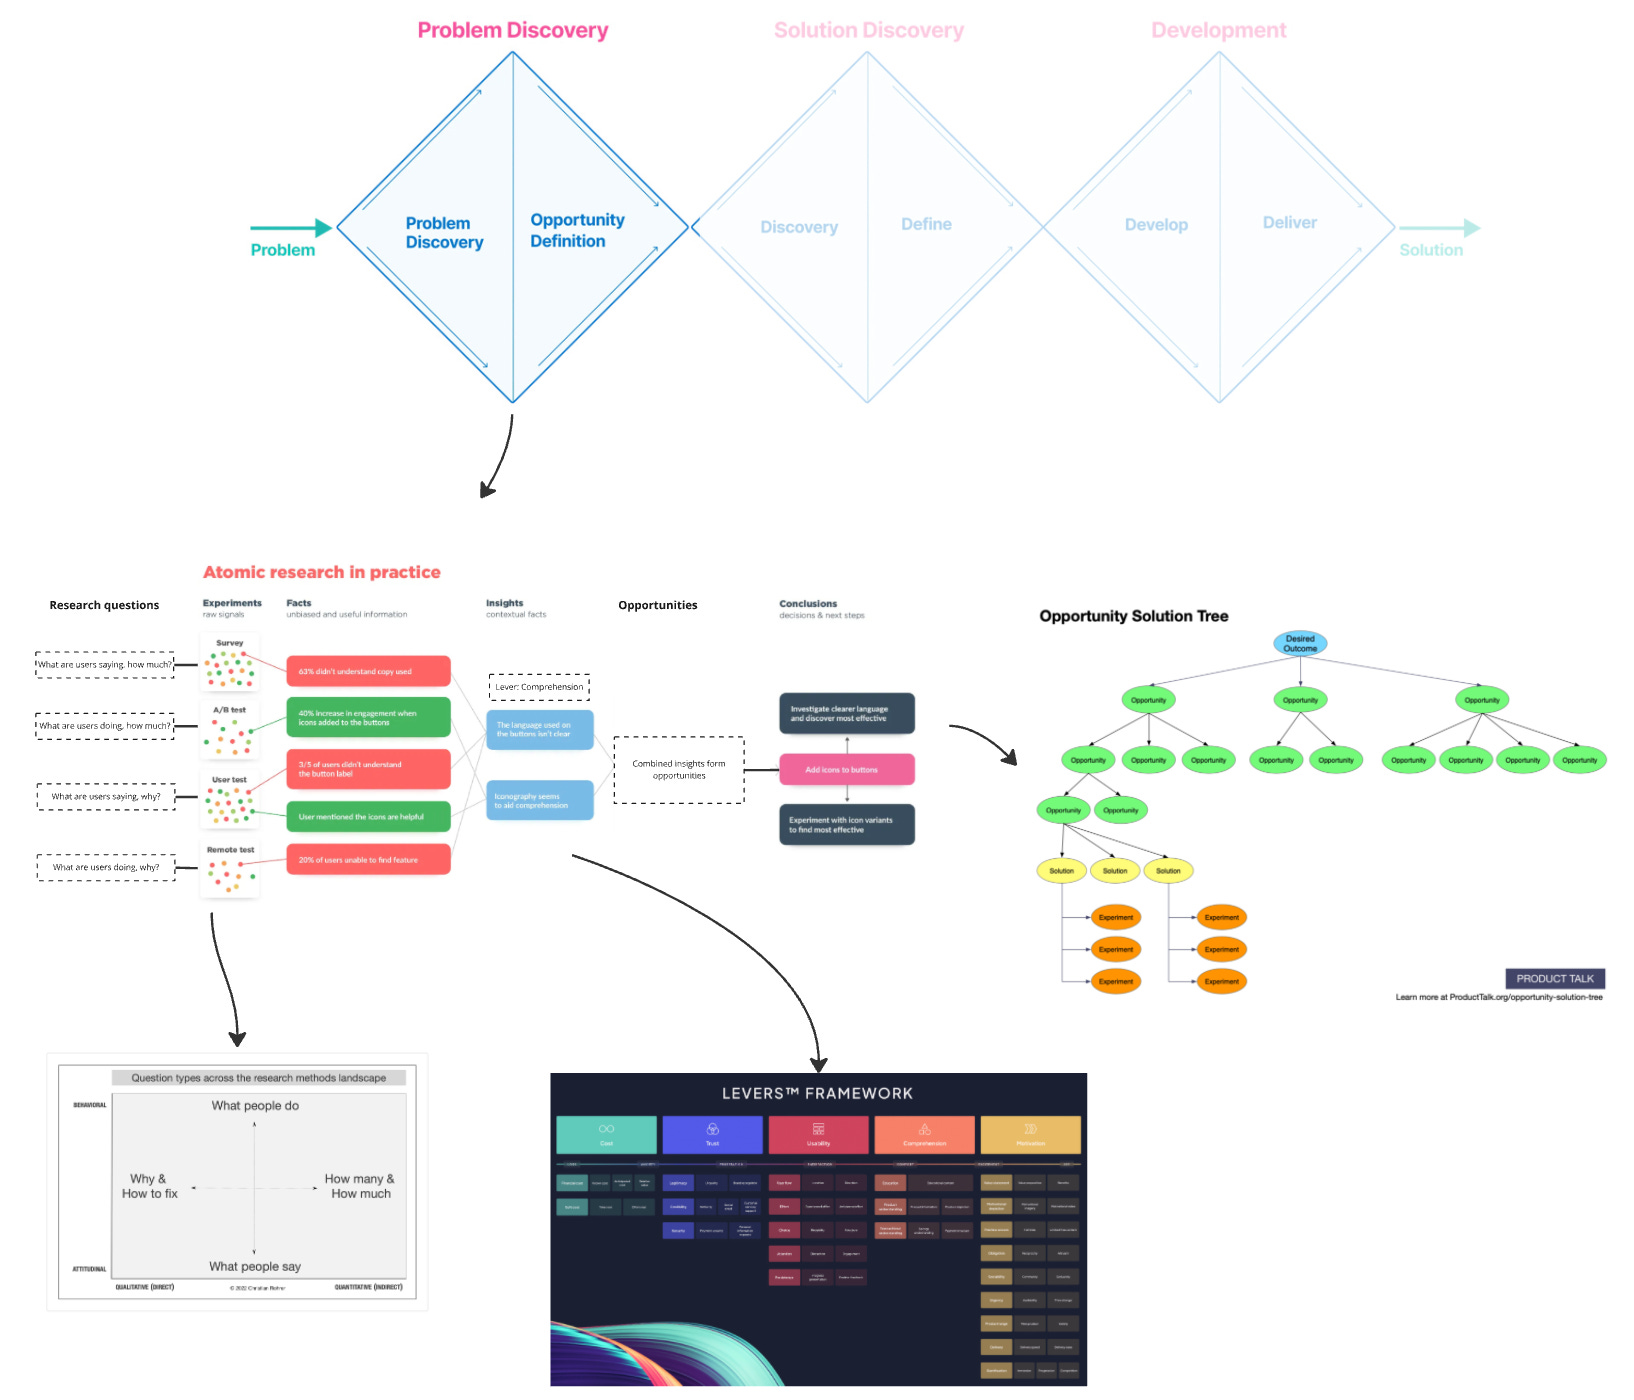
Source: Prototypr on Medium
Visualising this using all the steps creates this modified Frankenstein version. It doesn’t do justice to the original work, but it’s for education purposes I guess.
If you’re seeing this: sorry for butchering your beautiful framework Daniel.
Final note: stacking methods doesn’t mean you have to do everything in the same week. It means considering the insights from different methods and moments together as one (stacking). It’s the breaking down in smaller parts that this framework does that makes stacking easy to do that in practice.
One more to go. Almost there!
5. Manage and properly connect all your work, Opportunity Solution Trees
I saved my favourite for last. It looks simple which is good. It’s also very practical; you’ll use it basically every day when you’re doing the actual work.
I’ve based this entire section on the first article I ever read on Teresa’s website, which I found eye opening and led me to use the Opportunity Solution Tree (OST) basically everywhere I work.
Her website and newsletter are both excellent and should be on your reading list. Better yet, just buy her book Continuous Discovery Habits. It’s a fundamental read and simply will make you better in Product Discovery.
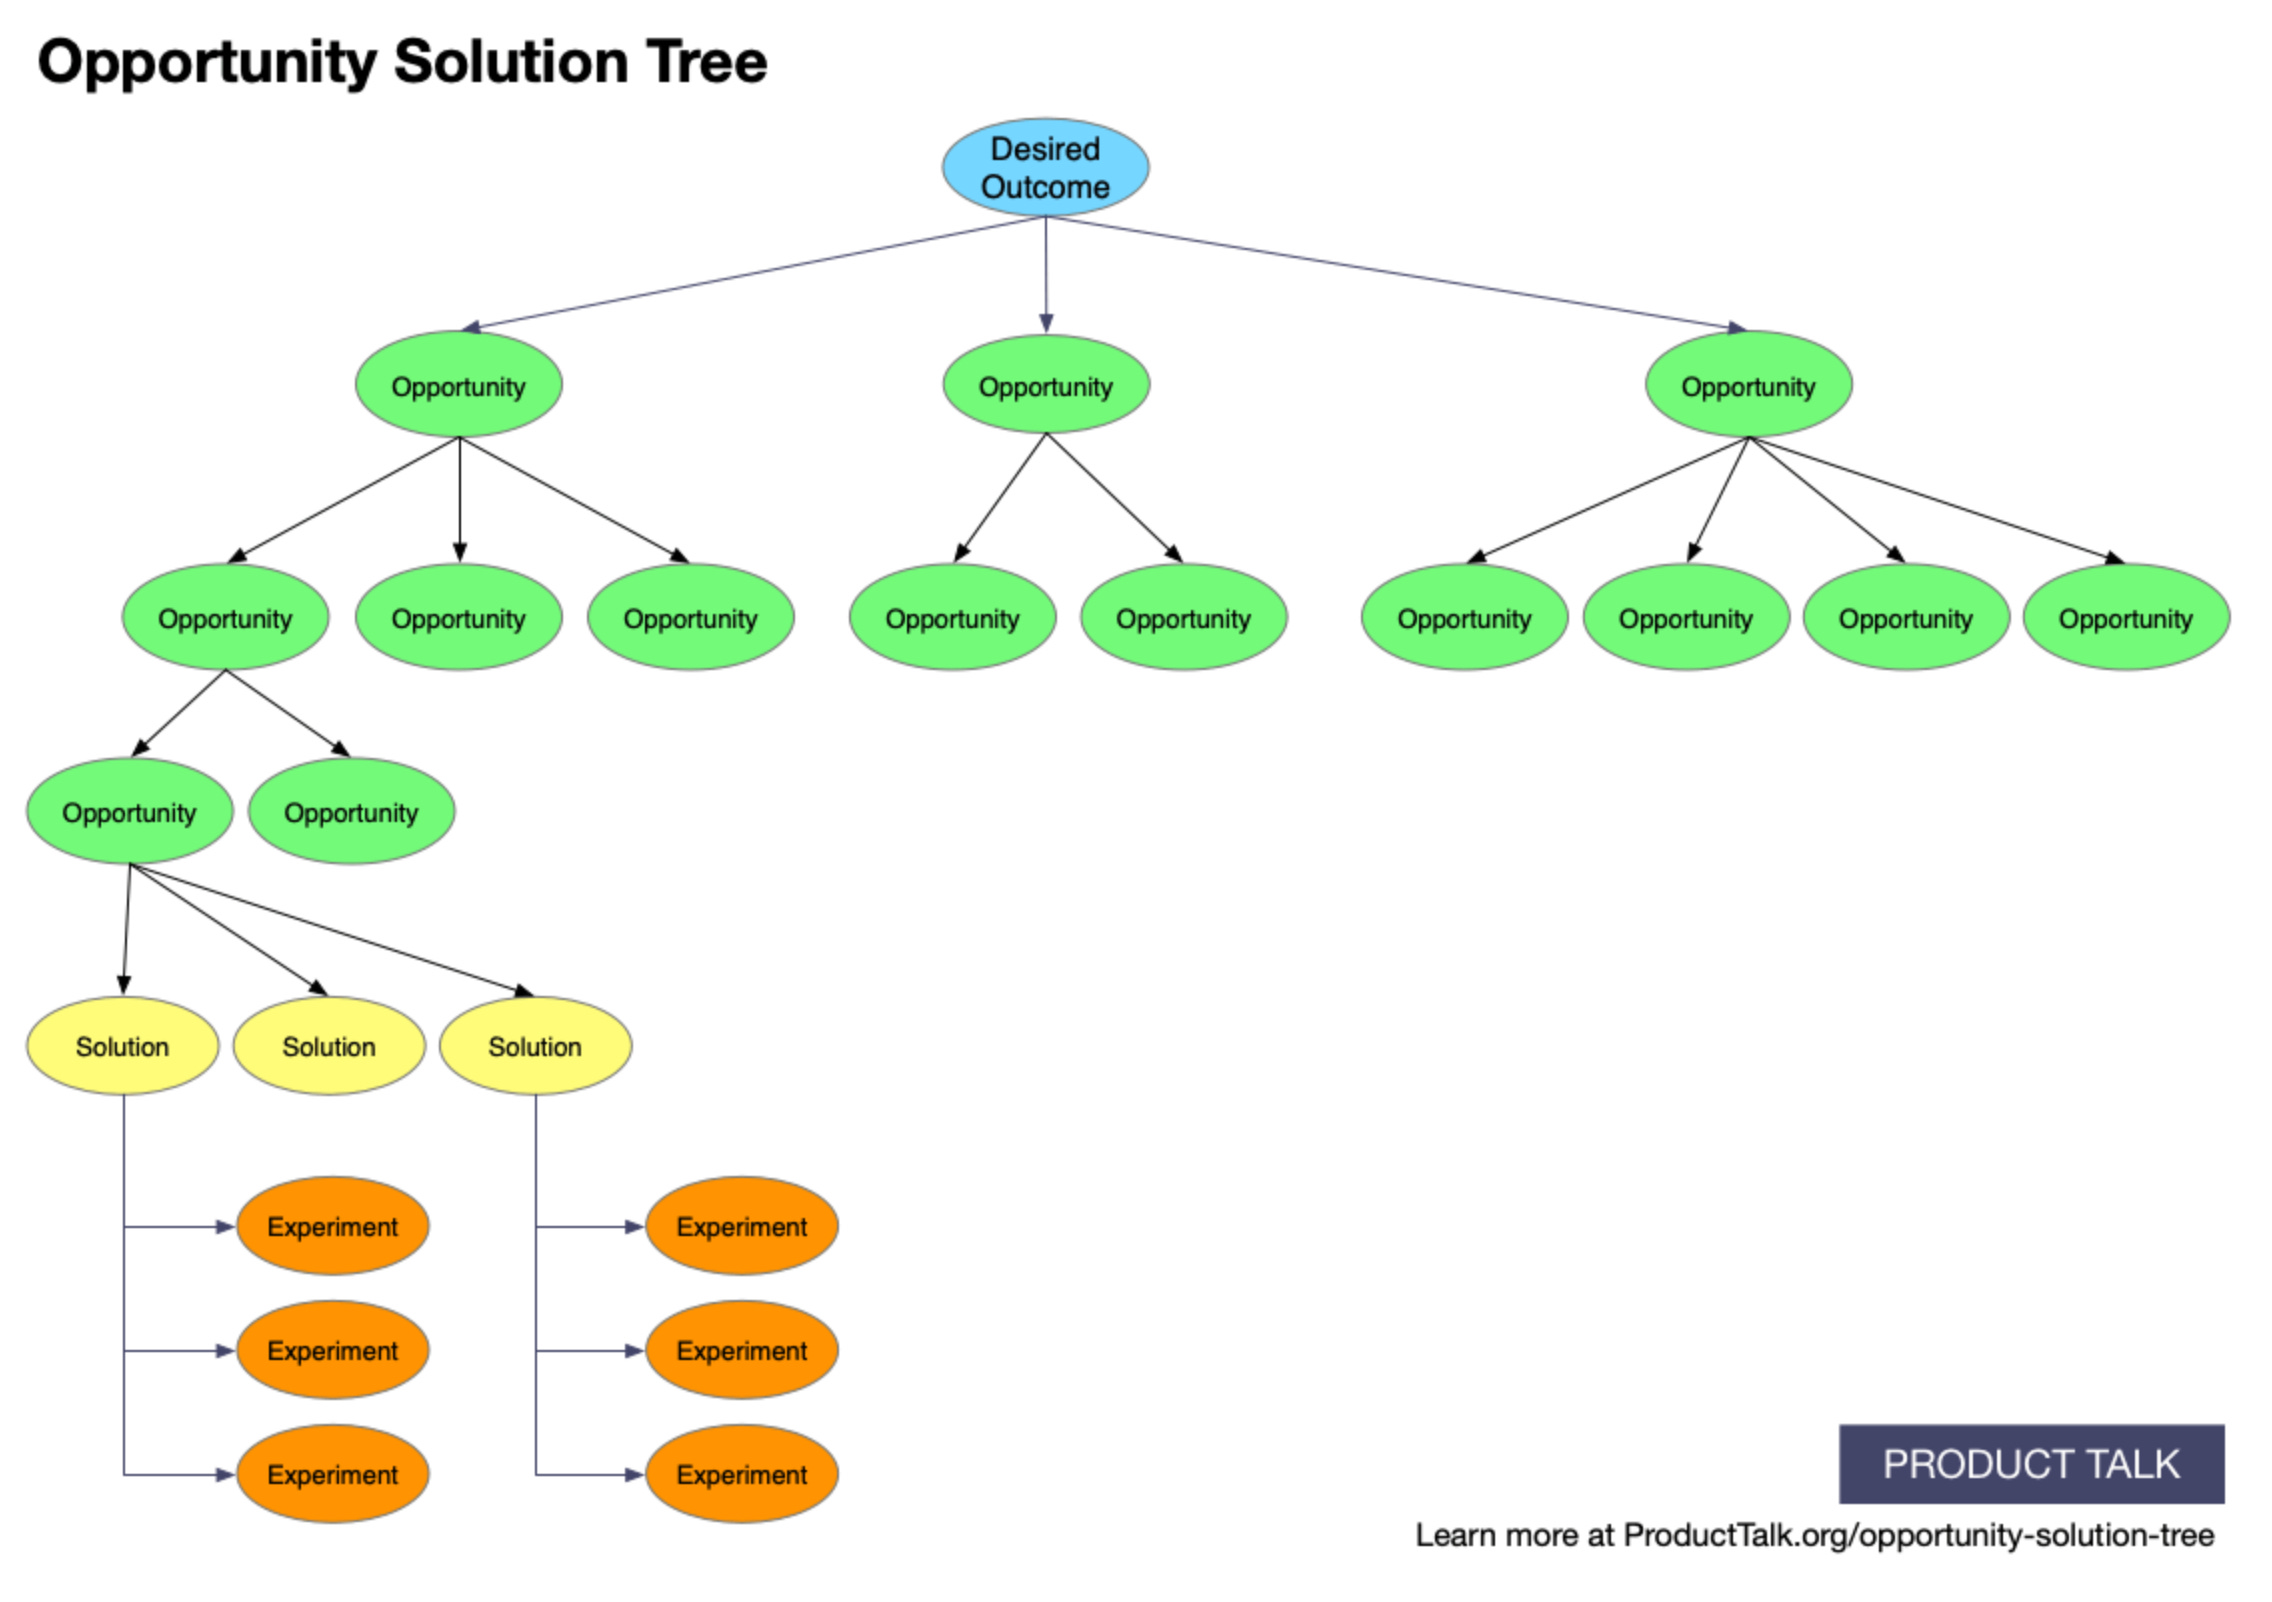
Source: Producttalk
What’s going on
You’ll recognise the tree-like structure from Conversion’s Lever Framework. It helps you see the connections between all the different parts in the discovery process:
Desired Outcome (blue) = we called this a goal up until now (e.g. sell more concert tickets). That’s fine, but outcome is better language. Outcomes (over outputs) if a whole post on its own so just roll with it for now.
Opportunity (green) = the problems your users are experiencing. A bigger topic you’re going to commit to, to try and fix or leverage. Opportunities are super important to get right, so the entire next post is going to be just about opportunities.
Solutions (yellow) = the solutions you’re building to help fix those problems; ideas. In the previous post we said that it helps to see ideas as solutions; this is where we stole that from.
Experiments (orange) = the experiments you’re running to see if those solutions actually work.
It also helps you to really, really, REALLY see all of these as separate entities part of single chain. You can’t confuse one with the other, you can’t have them floating around unconnected, and you (usually) can’t proceed without having all parts fleshed out.
This may sound obvious, but this is something that goes wrong in practice basically all the time.
The value for us in practice
There’s a ton of great content about the benefits of using OSTs. I’m not going to summarise all that, so I’ll share my personal perspective here.
I’ve mulled this over much longer than healthy but I think the core value of this thing, for me, comes down to seeing when your work doesn’t connect properly (and that’s HUGE).
1. It helps you see when your work doesn’t connect properly
And with see I mean literally see. It’s the visualisation. The laying out and connecting out all your work in a neat and single overview that reveals for you when something has gone rogue.
With connect I mean how your hard discovery work ties into the things you said you’d do this quarter and to the thing you’re going to do today to achieve that. It makes discovery the bridge between the two. Its strategy made simple and visual.
Here are 3 examples to bring this to life. Sorry for the cliché topic, but it just makes things easier to explain:
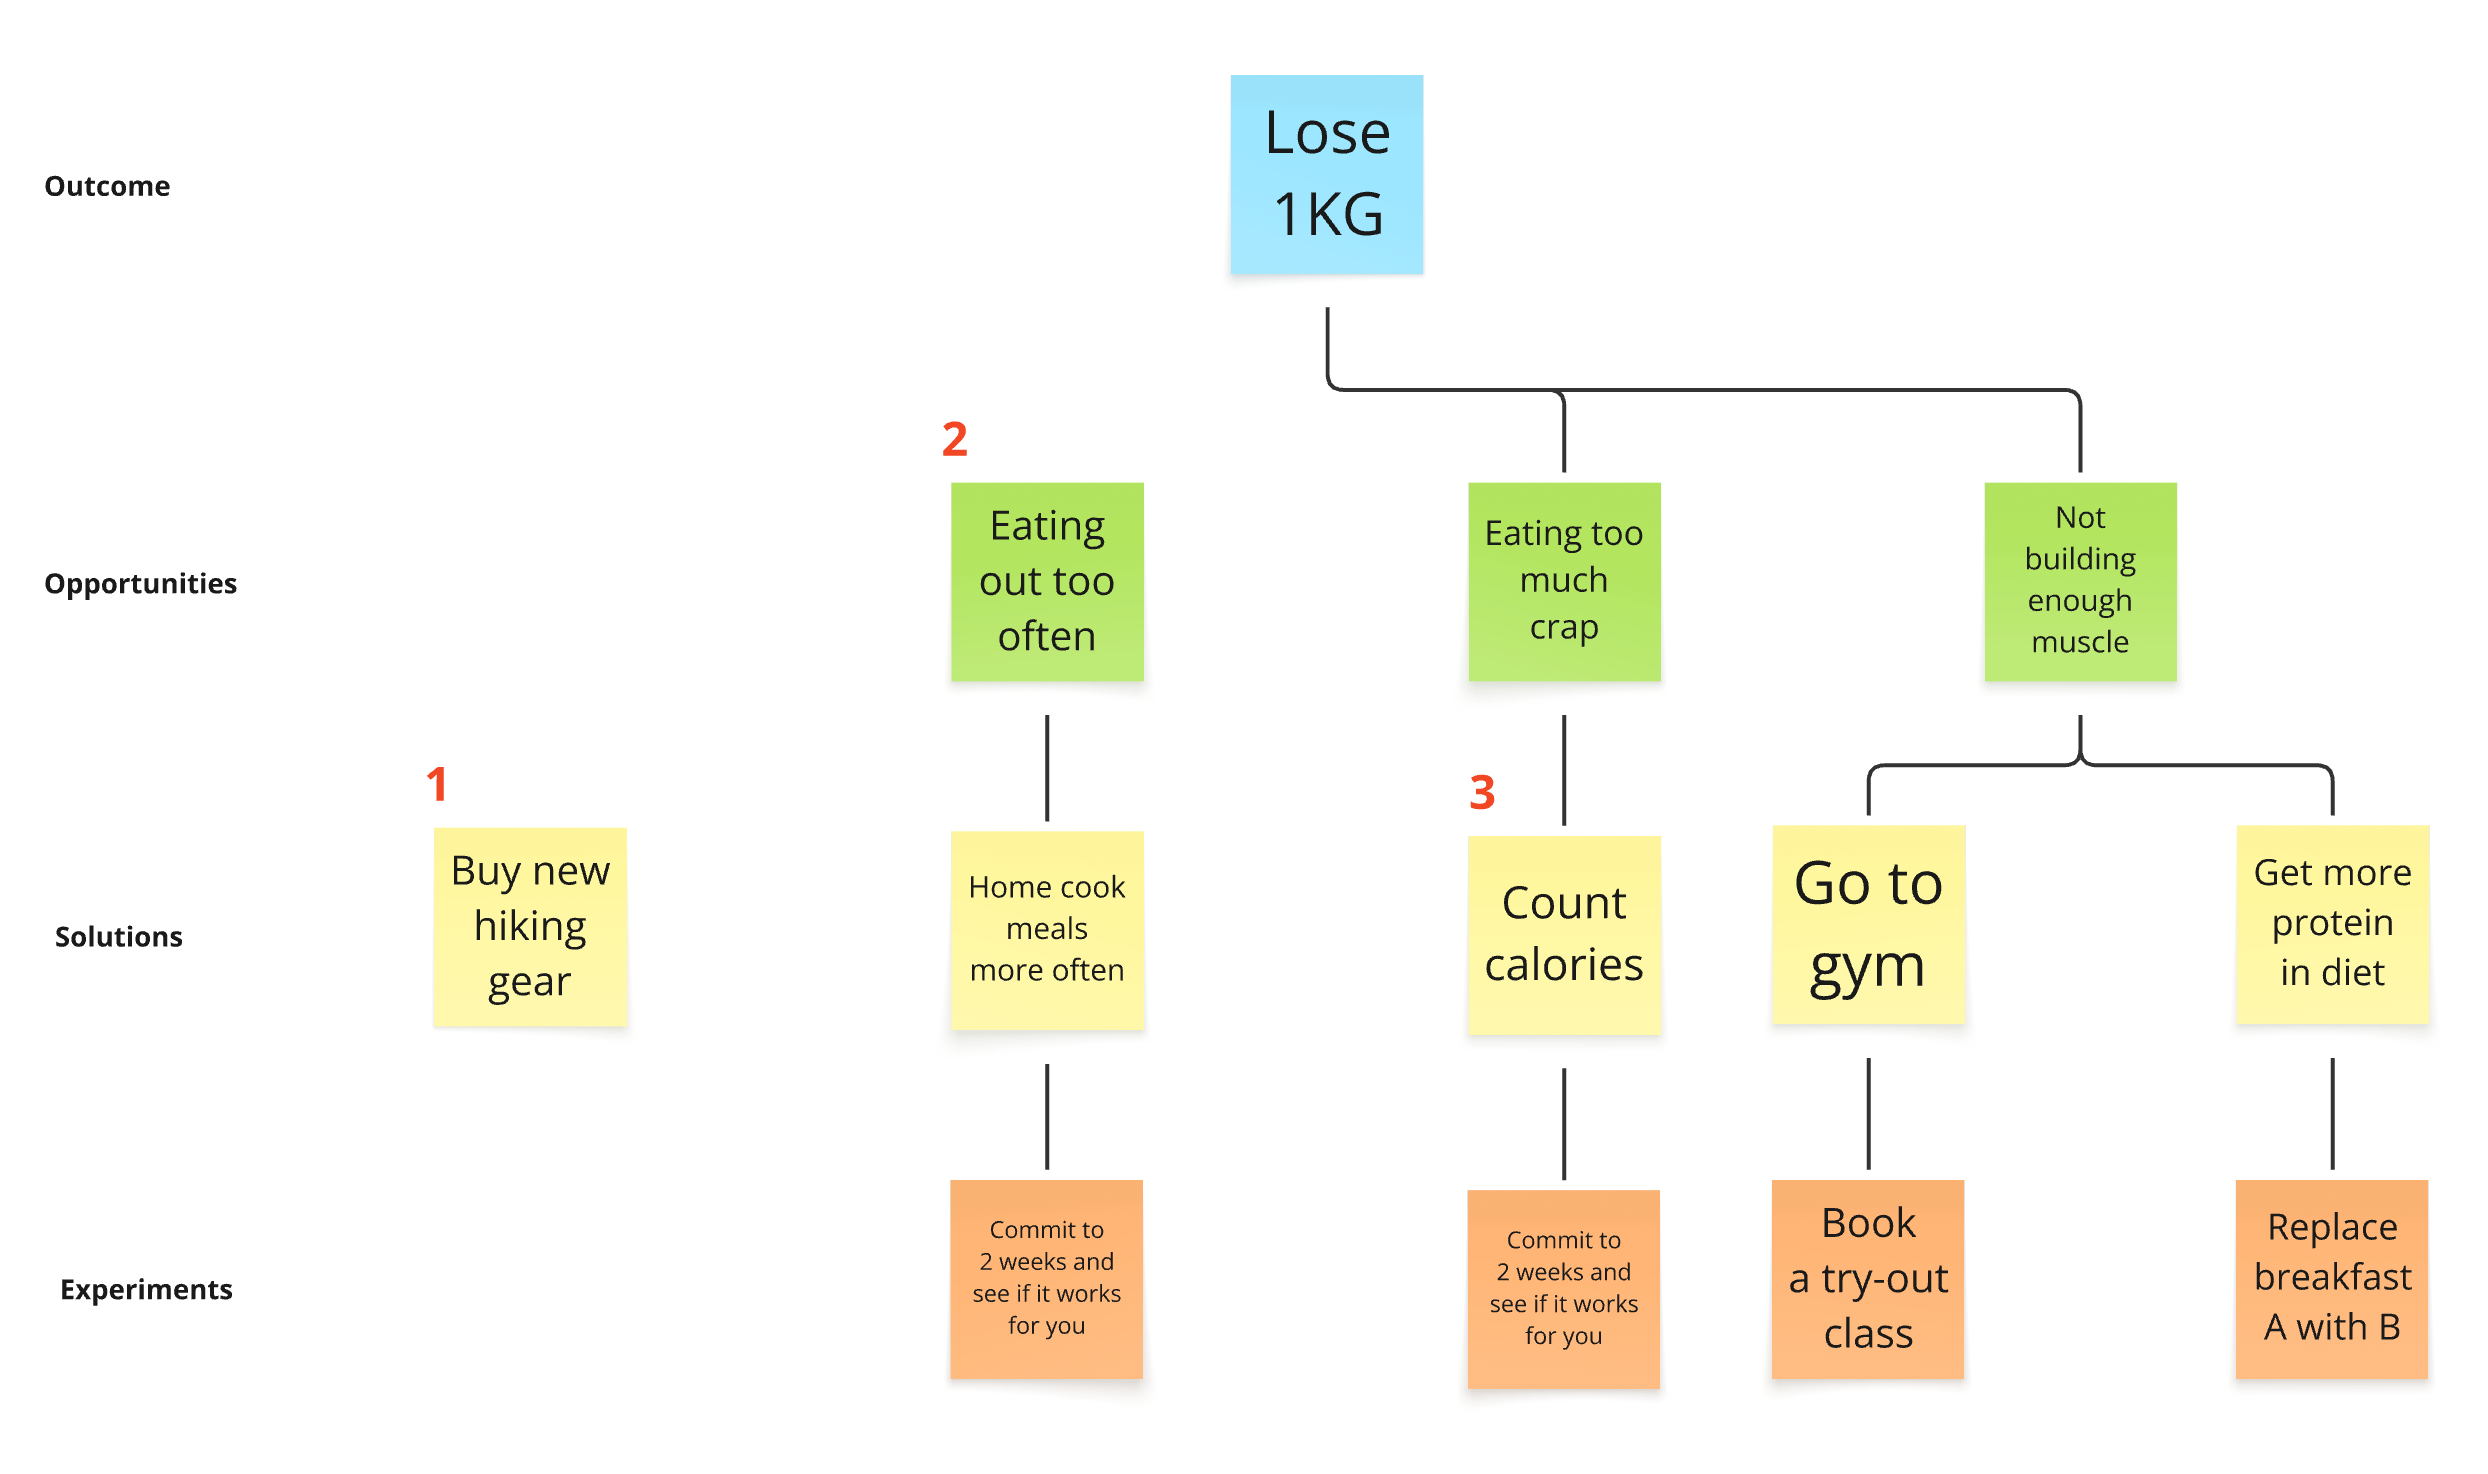
1) The solution that can’t be tied to an opportunity: Buy new hiking gear
So this happens at least once a week no matter how mature the organisation is. This is the result of idea-first thinking, and always is something that is really cool and shiny, but doesn’t solve a real problem your users have. You can’t tie it to an opportunity in your tree, so chances are small it will really help you drive the outcome. I would love new hiking gear, but sadly it won’t help me lose 1KG. Not really.
I could argue that I will hike more once I have them, but unless I have data that that is actually a problem, I’m just reasoning backwards from a solution to an opportunity. That’s a slippery slope.
In practice, this ranges from homepage carousels and chatbots back in the day, to “let’s do something with AI” today. Ideas like these aren’t inherently bad, you just have to be cautious when this happens. Do the work and see if the opportunity exists and it truly helps your users or if it’s just the next cool and shiny thing to have.
2) The opportunity that can’t be tied to the outcome: Eating out too often
Working very hard on irrelevant problems. This too happens regularly and is quite the tragedy. This is the result of not understanding the opportunity and the impact that it will have on behaviour and the outcome well enough. Sure, eating out less often might indirectly help me lose 1KG, but they’re not REALLY that well connected. It’s just as easy to take in too many calories at home as it is when eating out.
You can spend weeks home cooking all your meals every day. That’s a ton of effort and you would’ve saved a lot of money doing so. That money saved is a great outcome, just not the one we’ve been tasked to work on.
In practice this means spending weeks improving the loyalty programme whilst your goal was to increase the conversion of the onboarding flow. Doing a lot of hard work without having an impact to show for it in the end is risky business. You need to fully understand what metrics will shift if you were to change something, and whether that metric is the one you’re interested in.
3) The single solution connection: Count calories
If you have an opportunity with only a single solution, chances are you’re just going with first thing you came up with. That can be OK, but there’s a ton of value in considering and trying more solutions.
Counting calories is really annoying. So if I fail, what will I then do with the problem “eating too much crap?” Will I conclude that the problem can’t be solved or isn’t really there? And what if I succeed counting calories for 2 weeks? Does that mean the problem is solved and I move on to the next?
This sounds lame yet it happens every day in practice. Teams move so quickly that there’s hardly any room for iteration, yet it takes several attempts before you understand what works and what doesn’t.
It doesn’t really matter what the result of your first solution is. If it works, you keep going to see if you can push it even further. If it doesn’t then you know you need to try something else.
Improving digital products is not a does work vs doesn’t work, but a works better vs works worse kind of thing. Your first go is hardly ever the best one, so be open and try multiple solutions.
There are more situations where this tree helps you with the process, but I hope you’re convinced. It’s incredibly powerful and has many more benefits than “just” helping you connect all your work properly. If you could only apply 1 of all these frameworks we discussed, please let it be this one.
Recap
We did it.
The Triple diamond framework helps us see the bigger picture
It teaches us there’s a certain sequentiality in which to do things (start with problem, end with solution) and that there’s a point where you’ve done enough discovery and you need to get concrete: the work flows in a diverging to converging cycle (hence the diamonds).
The Landscape of User Research helps you ask better questions for better insight
The better the research question, the better the insight. The better the insight, the better the opportunity. The better the opportunity, the better result.
The trick is knowing what question to ask as it sets the whole thing off. Seeing your options categorised in 4 areas helps you with that: are you interested in what people say and do you want to ask follow-ups, or are you interested in what they do and need numbers at scale?
The Levers framework helps make sense of the insights and identify the patterns
It’s hard to spot and identify insights in the data if you don’t have the vocabulary to call them out. Better vocabulary means better diagnosis, which means more effective problem solving. Don’t replace the car, replace the fuel pump; your app isn’t broken, the usability in your onboarding flow is.
The long term benefit of this is that you’ll start seeing patterns in the UX, which help you form a discovery strategy. These levers also form a great starting point for research questions.

Atomic research teaches us to strengthen the signal by stacking the research methods
It’s a zoomed-in version of that first Problem Discovery diamond. It ties all the individual steps together and adds many to one relationships. The stacking enables us to draw insights that otherwise wouldn’t have made the cut, and it unlocks signal strength. More ties = more signals = likely more prio.

The Opportunity Solution Tree helps manage and connect all your work
Seeing the work mapped out in front of you helps you spot when things go rogue like solutions without opportunities, opportunities not connected to the right outcomes, or opportunities with just a single solution. All the work comes together in this tree. Getting the tree right means getting your strategy right.
Look at that.
The 5 frameworks nicely fit together. There are 100+ other really nice frameworks out there, but I honestly think that with this you have everything you need to start delivering value.
Next up, a detailed look at the process of the synthesis: turning insights into opportunities